The High Plains, Front Range and Rockies
Superstorm
June 14-17 1965
Related items of interest
Historical Tornado Cases for the Cheyenne Warning Area
Detailed Tornado Cases for the Cheyenne Warning Area
Historical Tornado Cases for the Boulder Warning Area
Historical Tornado Cases for the United States
Elevated Mixed Layer
Elevated Heating
High plains and front range topo maps
Overview
One of the
worst floods in Colorado State history occurred on June 15-18, 1965,
with 28 people losing their lives. Total damage was
about $540,000,000. The hardest hit counties were Weld,
Denver, Adams, Larimer, Morgan,
Lincoln, Arapahoe,
Elbert, El Paso, Teller, Park, Fremont, Otero, Baca,
and Prowers. Extensive flooding occurred in the mountains and
foothills of New Mexico. The hardest hit
area was Colfax county around Raton
and Las Vegas. Total damage
exceeded $5,000,000. Flash flooding occurred in Wyoming with at
least 1 fatality. Dodge City experienced
it's worst river
flood of record on June 19 in spite of negligible rainfall in the Dodge
City area. Here are some links
that detail the sequence
of flooding events as well
as rain amounts and riverflow.
Flood Summary
South Platte Flood
Larkspur Flooding
Deer Trail Flooding
Detailed report on the 1965 flood
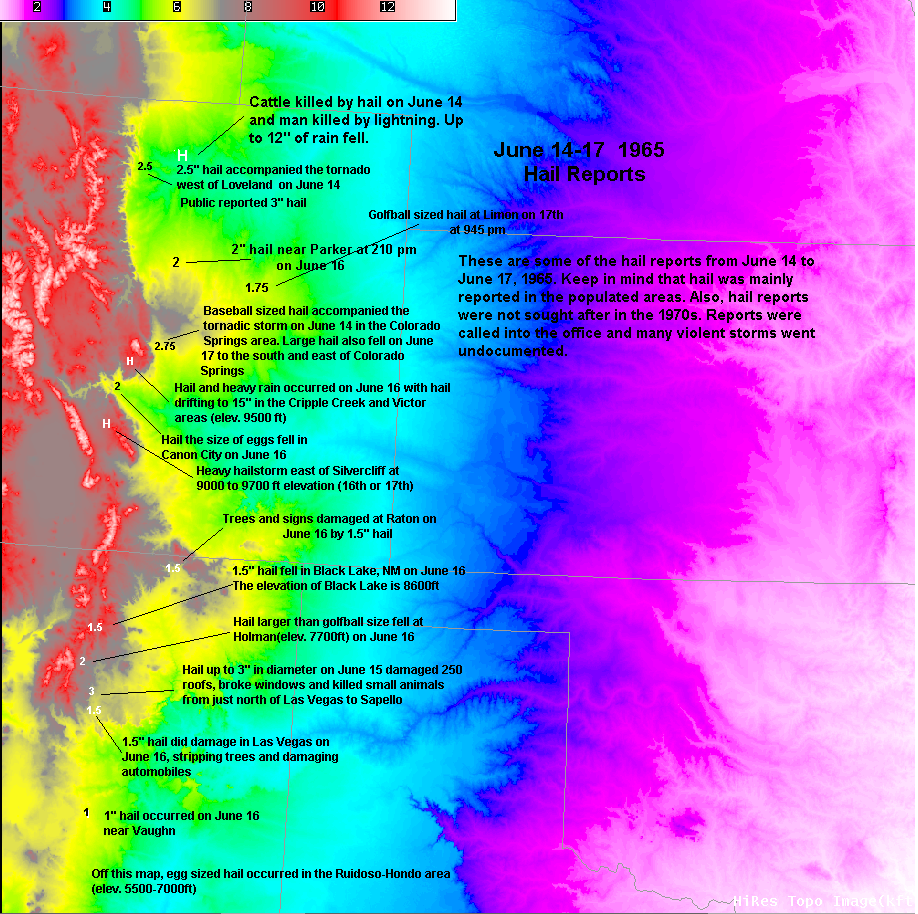
Severe storms
occurred up and down the front range and foothills from Ruidoso, NM to
Casper and Worland, WY. Although storm
reports were not sought after in the 1970s, there were
several reports
of very
large hail.
Tornadoes
occurred on the
14th,
15th 16th and
17th. Most of these were in sparsely populated areas and some surely went
unreported or unseen. After I made the above severe weather maps, I searched the
Douglas Budget and documented a
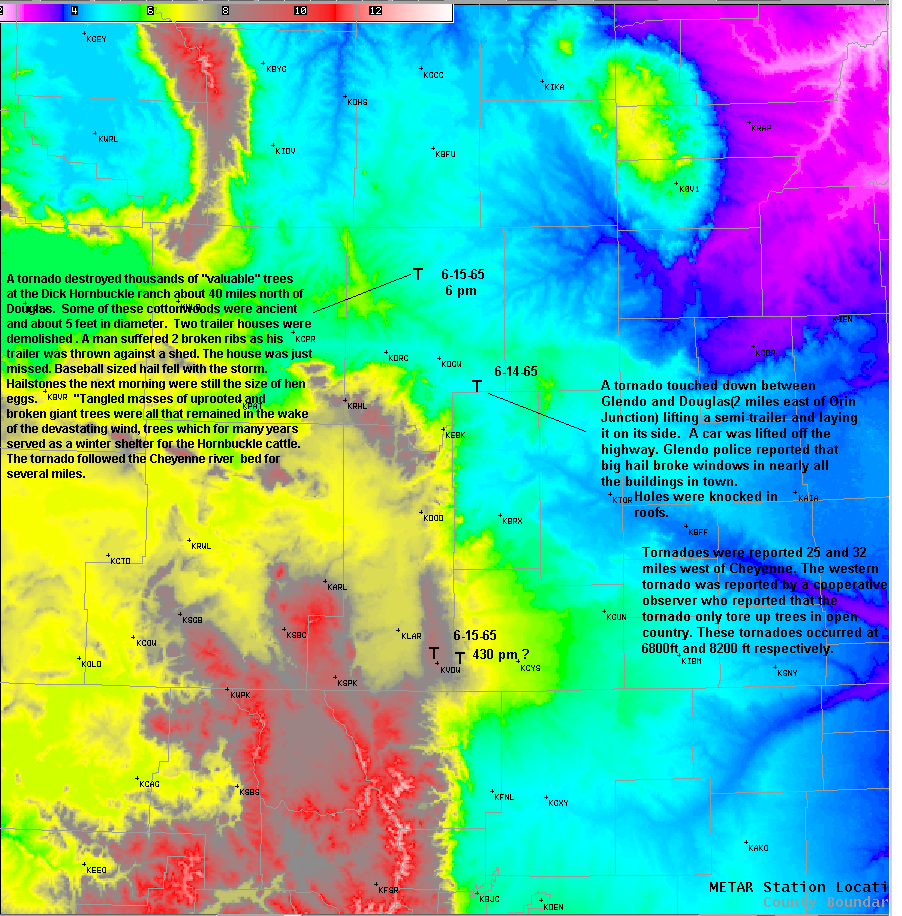
tornado and baseball sized hail that occurred on June 15. This tornado
or hailstorm is not included in the national
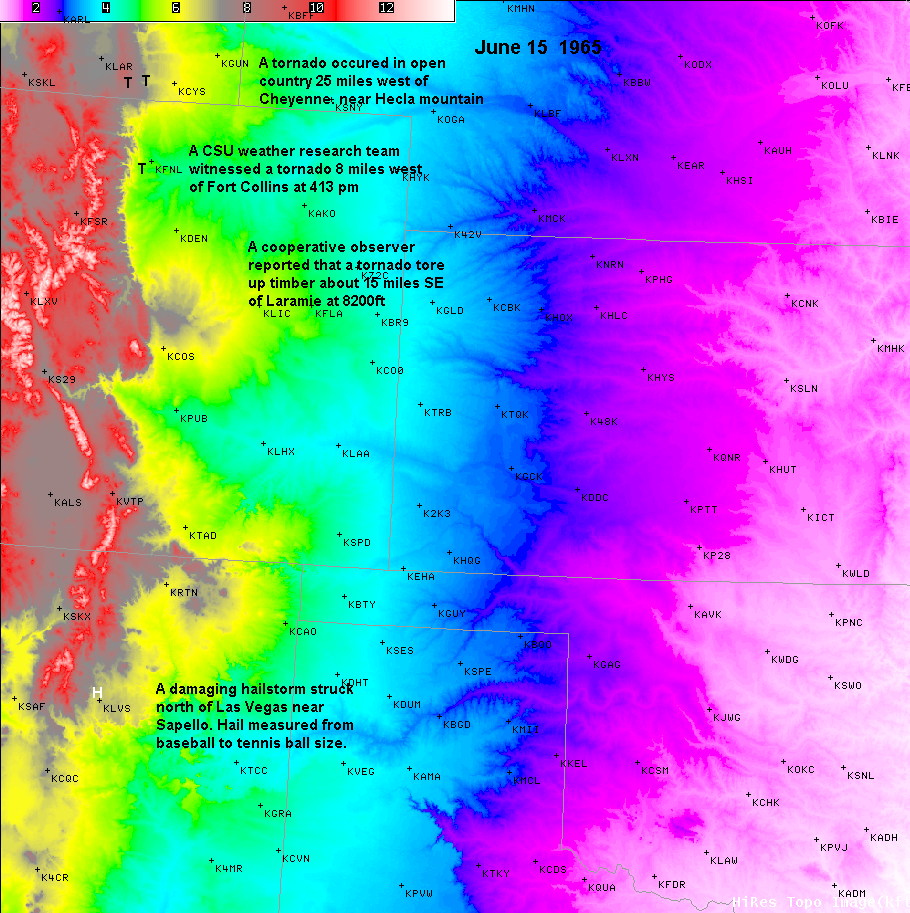
severe storm databases. Here is a
map that details the severe storm events on June 14 and 15.
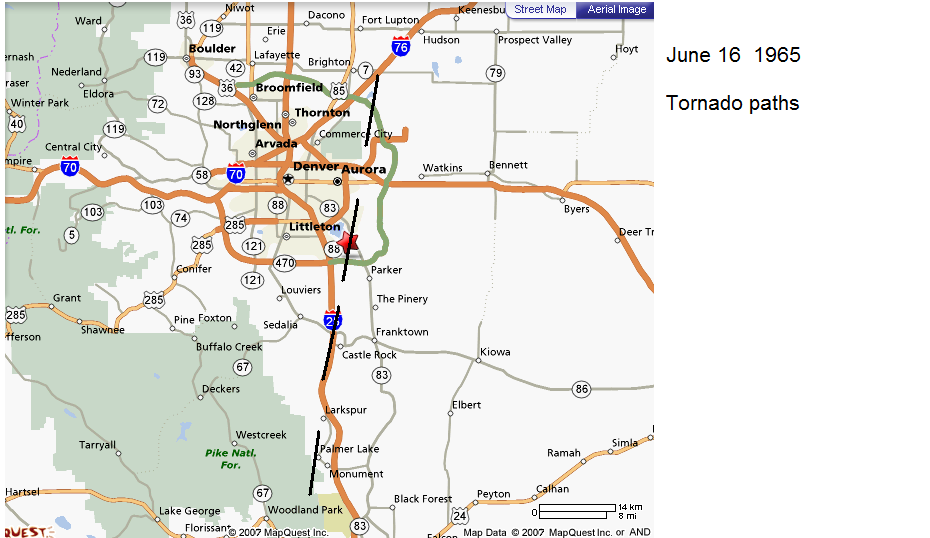
The tornado paths for the 16th can be
found
here.
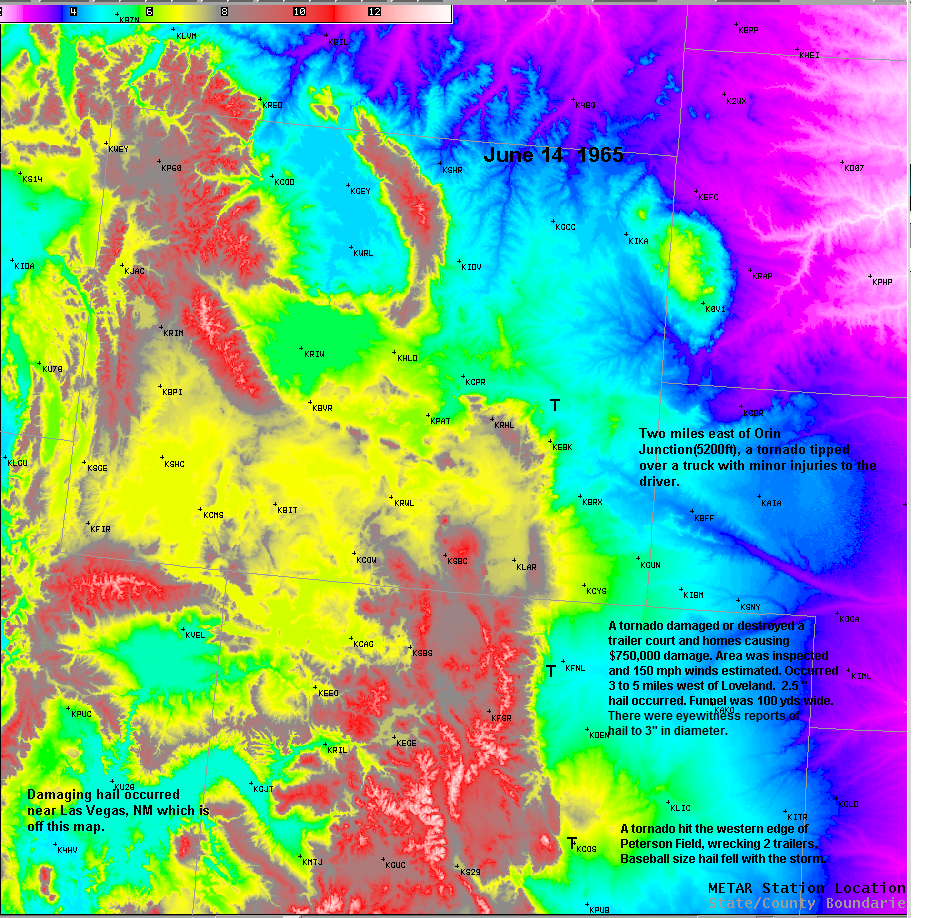
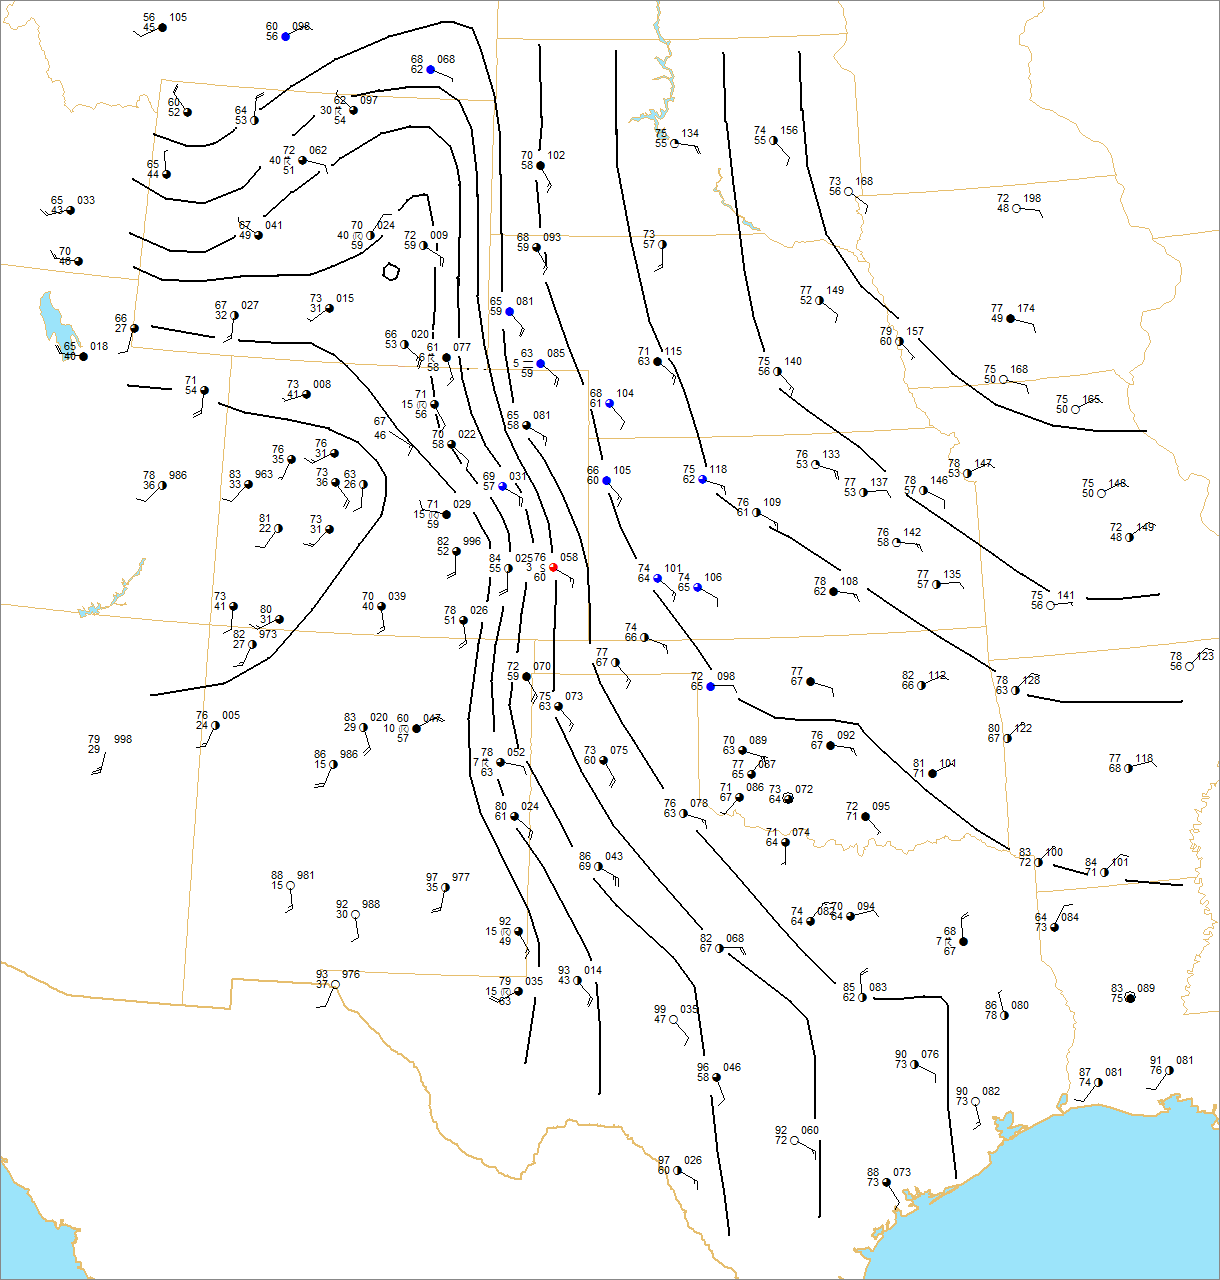
June 14
Late on June
13 and early on
June 14, 1965, low level upslope flow pushed moisture onto the front range. Two frontal boundaries
were present by the
22 UTC June 14. The northern front extended from southern Colorado across Oklahoma and Arkansas.
The southern front extended up and down the front range into New
Mexico and Texas. Very unstable conditions
existed along the length of the front range, with the highest
instability further north in Colorado and Wyoming.
The 00z June
15 500mb chart showed a deep trough in the western US with
moderate mid level flow as far east as the front
range of Colorado. The 6km flow (close to 400mb at Denver) was 40kts, which is fairly strong by eastern Colorado
standards in mid June. It was fairly cold aloft for mid June with 400mb
temperatures from -22 to -24C and 300mb temps from -38C to -40C. 700mb temps were 15C at Albuquerque, +13C at Denver and slightly cooler further north in
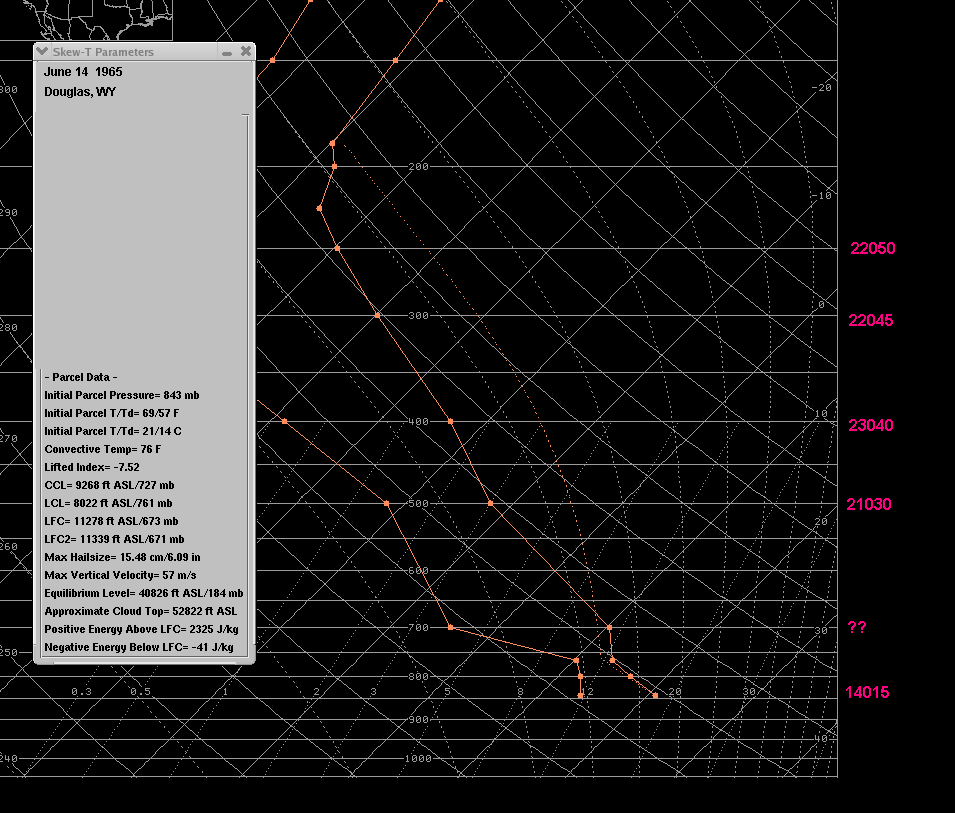
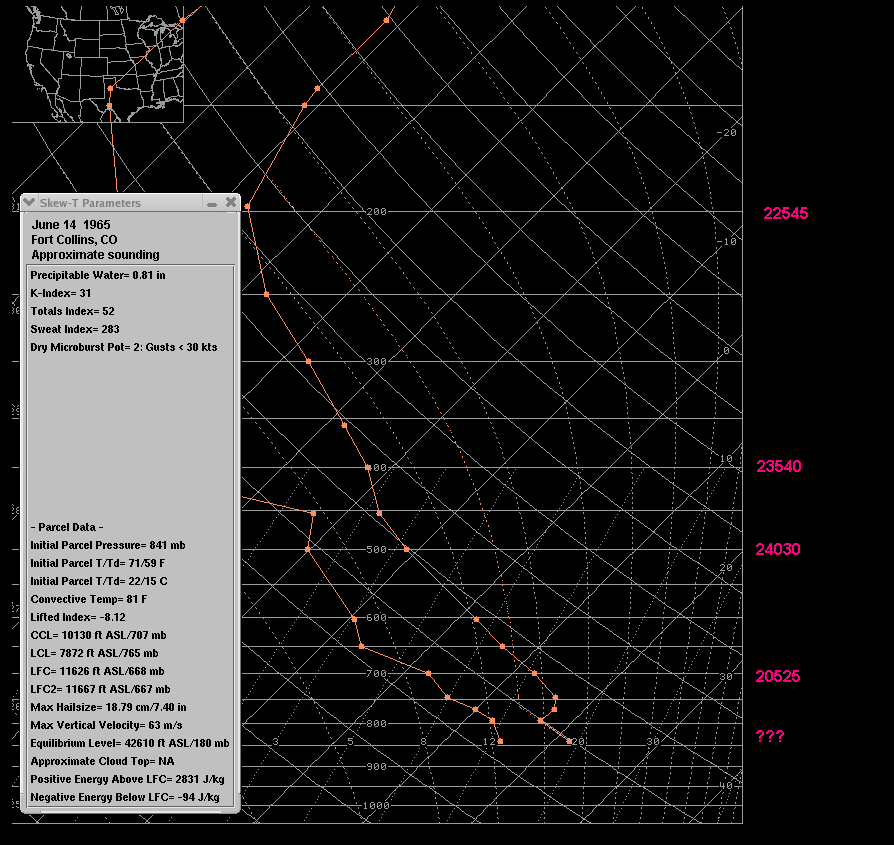
Wyoming. Approximate soundings for Douglas, WY and Fort Collins,
CO showed moderate to high surface based CAPE from 2300
to 2800 j/kg. Tornadoes occurred 3 to 5 miles west of Loveland and southeast of Douglas, WY.
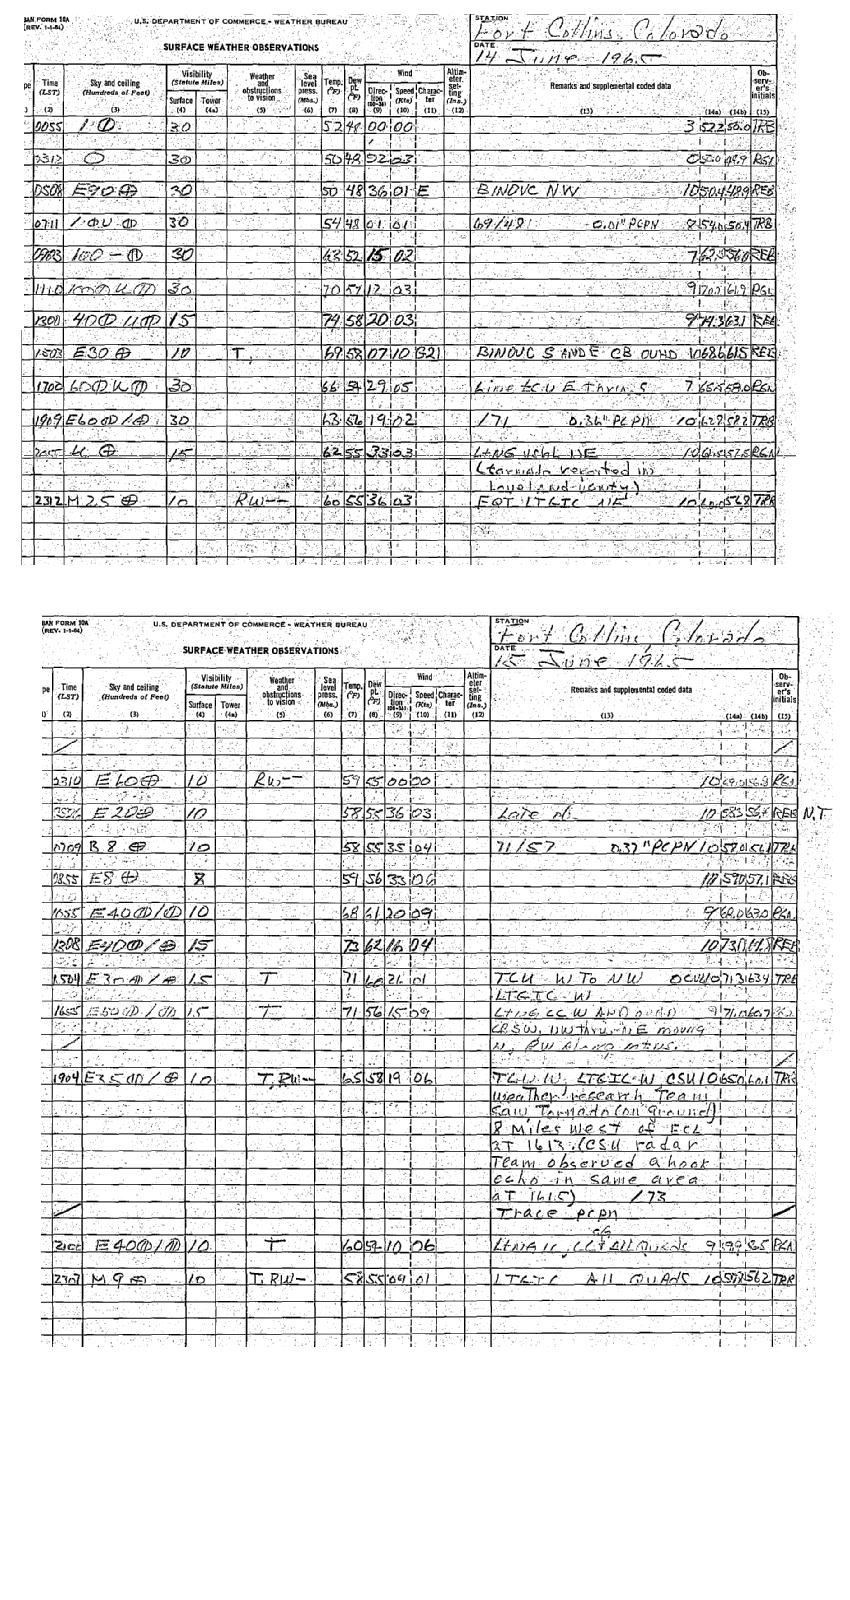
The
surface observation
form Fort Collins makes reference to the tornado that
occurred west of Loveland that lasted for 15 minutes. The
capping inversion was
obviously much weaker in
the foothills and mountains southwest of Fort Collins where
the storm developed. The storm probably
initiated on the edge of the mountains west or southwest of
Loveland. Given the sw
to wsw mid
level flow, the storm
probably moved to the ene or east.
Tornadoes also
occurred near Douglas, WY and at Colorado Springs. Baseball sized
hail fell in Colorado Springs. The
tornado occurred at Peterson Field in Colorado Springs.
The other upper air charts are: 850mb 200mb
The
theta-e was higher at Las Vegas than at Chanute, even though the
T/TD
were 4F/19F higher at Chanute. This is because elevated
heating
resulted in a potential temperature of 108F at Las Vegas. This
offsets
the moisture deficit at Las Vegas. The highest
theta-e was at
Colorado
Springs where the T/TD were 11F and 13F lower than at Mcalester, OK.
| 22 UTC |
Elev(ft) |
Pres.(mb) |
SLP(mb) |
T(F) |
Td(F) |
MR(g/kg) |
theta(F) |
theta-e(K) |
| Las Vegas |
6800 |
788 |
1002 |
71 |
47 |
8.8 |
108.3 |
343.4 |
| Colo. Springs |
6140 |
806.8 |
1004 |
75 |
57 |
12.5 |
108.9 |
355.0 |
Denver
|
5300 |
830 |
1003.6 |
73 |
55 |
11.3 |
102 |
347.0 |
| Chanute |
950 |
975 |
1010 |
75 |
66 |
14.2 |
78.9 |
340.9 |
| Mcalester |
487 |
988 |
1007.6 |
86 |
70 |
16.2 |
87.9 |
352.6 |
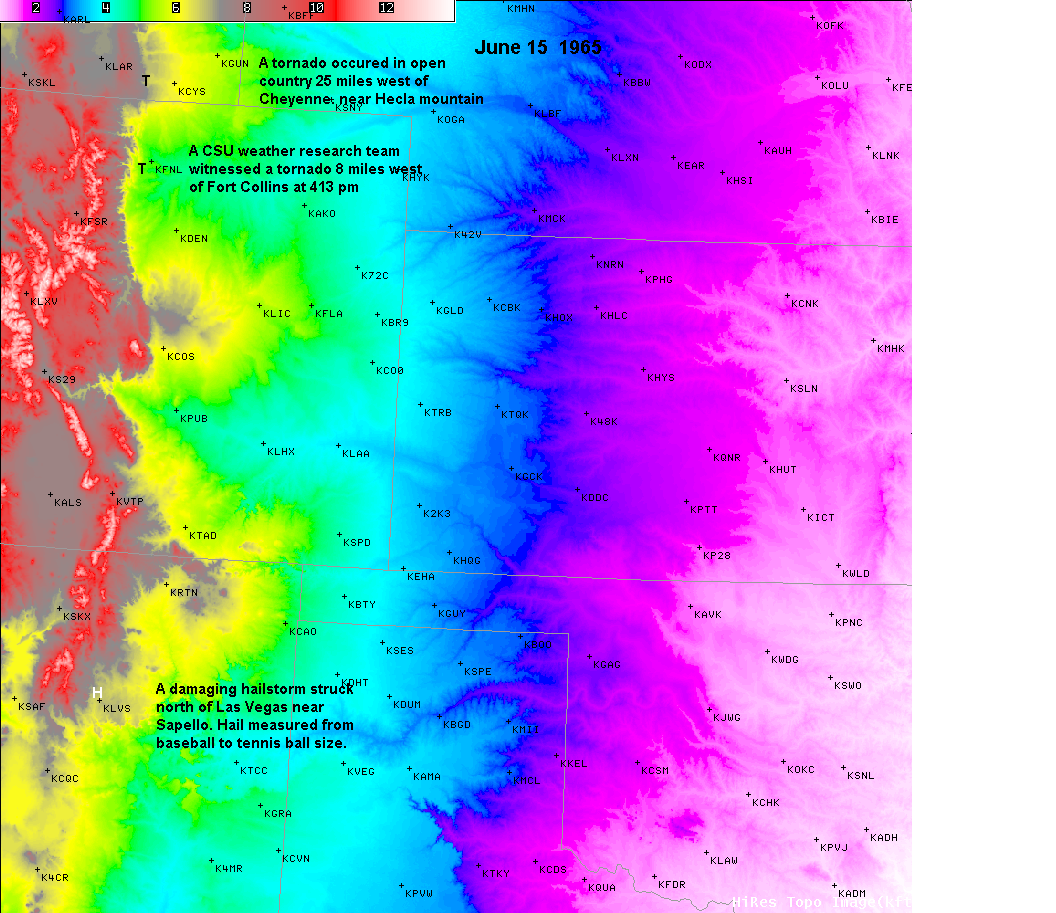
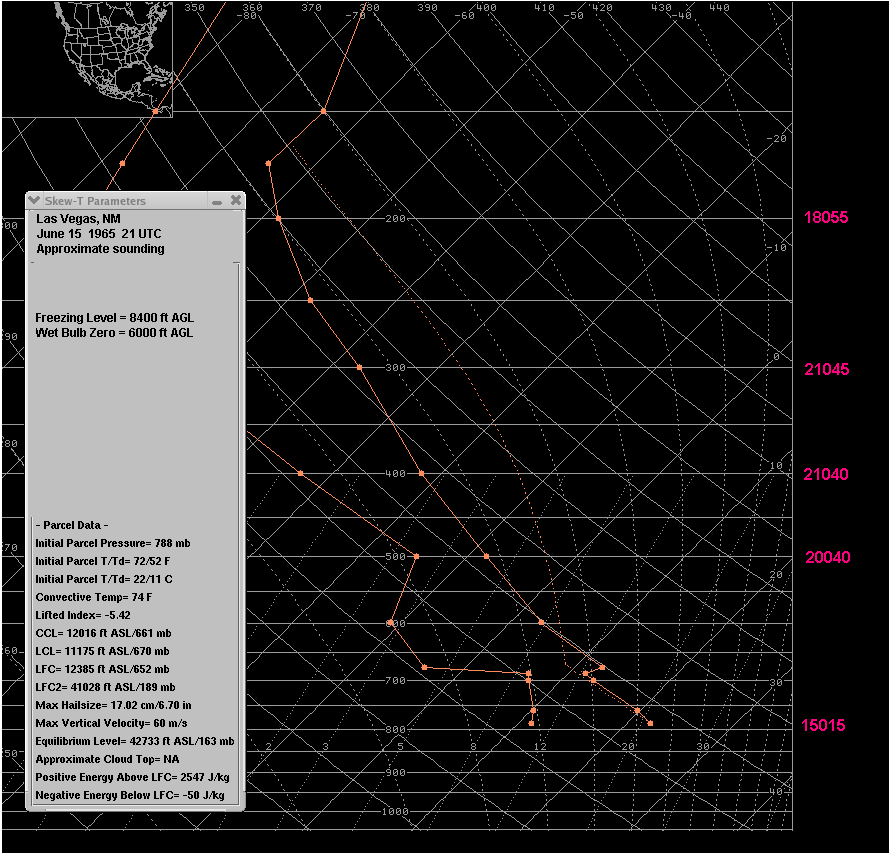
June 15
On
June
15, 1965 , a tornado was observed by a weather research team at Colorado State University. The surface
observation sheet from Fort Collins indicated that a weather research team witnessed a tornado 8 miles west of Fort Collins
at 413 pm.
A major hailstorm occurred in the northern suburbs of
Las Vegas, NM and Sapello, NM with hail up to 3" in diameter.
A cooperative observer 32 miles west of Cheyenne reported that a
tornado
tore up some timber but hit no structures. This tornado was probably
located near Vedauwoo at 8400 ft. Officially, there is a tornado
listed near Hecla (20 west of
Cheyenne), but nothing further west near Vedauwoo.
A tornado
destroyed thousands of valuable trees at the Dick Hornbuckle ranch 40
miles north of Gillette, WY. Some of these trees
were ancient and 5 ft in diameter. Two trailer houses were
demolished. A man suffered broken ribs. Baseball sized hail remained
until the next day. Tangled masses of downed
trees were all that remained of these trees that served as
a winter cattle shelter
for years.
The
Denver sounding from 12 UTC June 15 had a loaded gun appearance with rich moisture up to 700mb. With surface heating,
strong instability would be present. The
500mb chart showed 40kts as far east as Denver and Albuquerque with fairly cool
500mb temperatures. The
700mb chart featured a warm plume covering the southern Rockies.
The
19 UTC surface chart showed 2
areas of moist upslope flow--one in New
Mexico and the other in northeast Colorado back to the
front range. The
00 UTC surface chart is here.
The approximate sounding for Las Vegas, NM for 21 UTC showed 2500 j/kg CAPE, with a freezing level of 8400 ft AGL
and web-bulb zero height of 6000 ft AGL.
The mid to
high level flow became more meridional by 00 UTC June 16 as seen on the
500mb,
400mb,
300mb and
200mb charts. The leading edge of the
stronger flow was right along the front range. This would remain the
case through June 17. All these charts
are
valid at 00 UTC June 16.
The
700mb
chart showed a warm plume extending from Old Mexico to Albuquerque to
southern Wyoming. So how was I able to
analyze >+14C 700mb temperatures at Eagle, Aspen, Alamosa, and
Rawlins despite the lack of supporting 700mb observations?
I found the temperatures and surface pressures at 19 UTC (local
noon) or 22 UTC from the observation sheets and lifted these
values up
the dry adiabats to 700mb. 700mb was actually in the moist layer
at Laramie, WY. So there was a sharp gradient in 700mb temperatures
between Rawlins and Laramie.
The other 00 UTC upper air charts are: 850mb
The T/TD
were 18F and 13F higher at Tulsa compared to
Las Vegas
but the theta-e was slightly higher at Las Vegas. The T/TD
were 9F/12F lower at Denver compared to Ardmore but the theta-e
was slightly higher at Denver. The potential temperature at
Santa Fe was 111F. This makes up for the lack of moisture(mixing ratio
9.5 g/kg) as the theta-e was higher than at Tulsa
(T/TD of 84F/66F). So even though the mixing ratio was 47%
lower
at Santa Fe, and the temperature 8F lower than at Tulsa, the theta-e
was actually higher at Santa Fe
since the potential temperature was 111F.
| 19 UTC |
Elev(ft) |
Pres.(mb) |
SLP(mb) |
T(F) |
Td(F) |
MR(g/kg) |
theta(F) |
theta-e(K) |
| Santa Fe |
6350 |
800 |
1002 |
76 |
49 |
9.5 |
111.2 |
346.9 |
| Las Vegas |
6760 |
789 |
1004 |
66 |
53 |
11 |
102.8 |
346.7 |
Denver
|
5300 |
830 |
1003.4 |
75 |
60 |
13.5 |
104.2 |
355.3 |
| Mcalester |
487 |
988 |
1010.8 |
86 |
70 |
16.2 |
85.8 |
353 |
| Tulsa |
600 |
988 |
1011.9 |
84 |
66 |
14 |
86.9 |
345.6 |
| Ardmore |
750 |
983 |
1009.9 |
83 |
72 |
17.4 |
85.7 |
354.8 |
| Waco |
500 |
990 |
1007.8 |
92 |
67 |
14.5 |
93.6 |
351.4 |
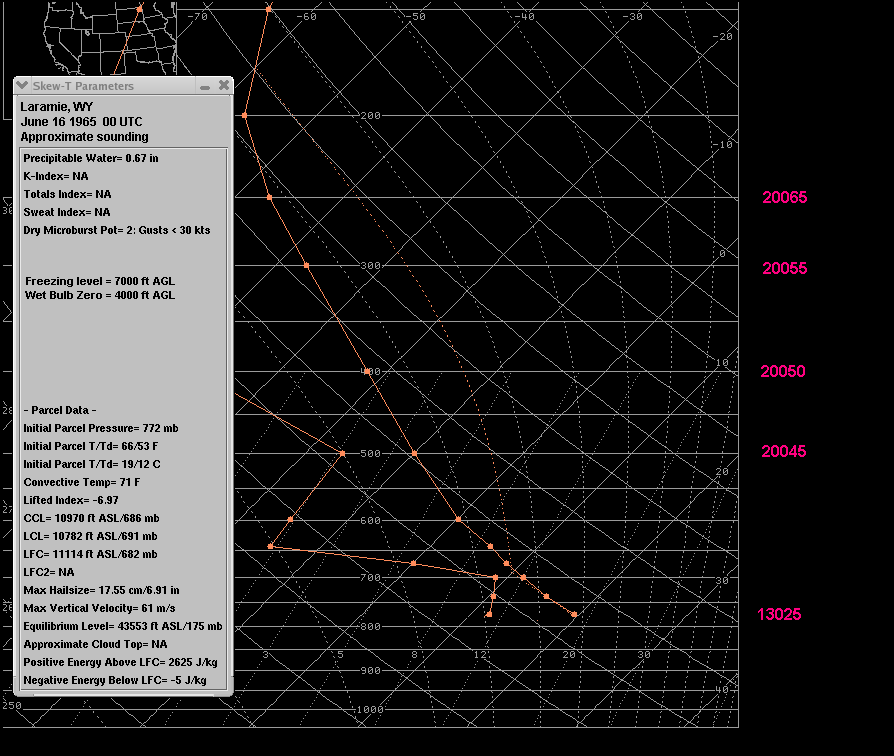
An approximate
sounding for
Laramie for most unstable late
afternoon conditions shows about 2600 j/kg CAPE and strong 0-3 km vertical wind
shear. The theta-e was higher at Laramie and Las Vegas than Tulsa
despite the temperature and dewpoint
being much lower. So even through the mixing ratio was 25% lower
at Laramie than Tulsa, the potential temperature was 19F higher at
Laramie. The freezing level at Laramie was about 6000 ft AGL and wet
bulb zero height 4000 ft
AGL.
| 00 UTC |
Elev(ft) |
Pres.(mb) |
SLP(mb) |
T(F) |
Td(F) |
MR(g/kg) |
theta(F) |
theta-e(K) |
| Laramie |
7200 |
772 |
1000 |
66 |
53 |
11.2 |
106.3 |
349.7 |
| Las Vegas |
6800 |
789 |
1004 |
60 |
57 |
12.8 |
96.6 |
348.1 |
| Mcalester |
487 |
984 |
1010.1 |
81 |
71 |
16.8 |
83.5 |
351.5 |
| Tulsa |
600 |
987 |
1011.9 |
82 |
66 |
14 |
86.9 |
343 |
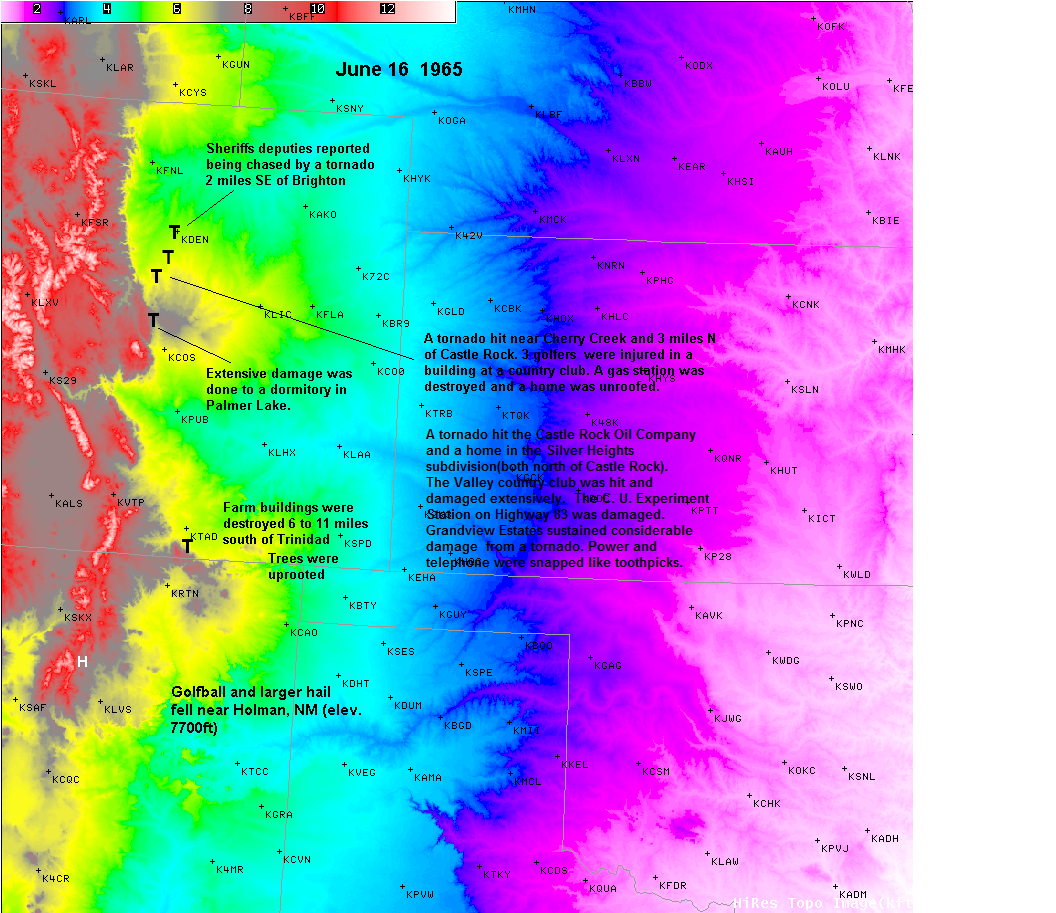
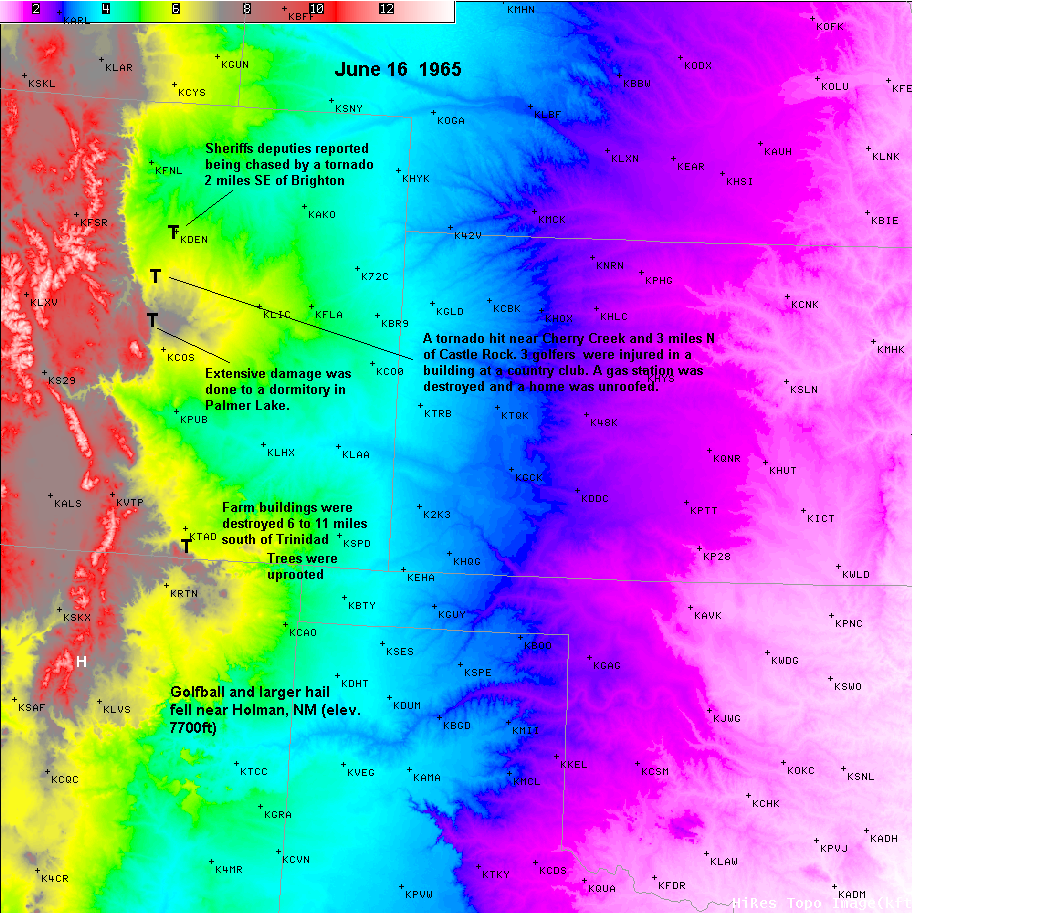
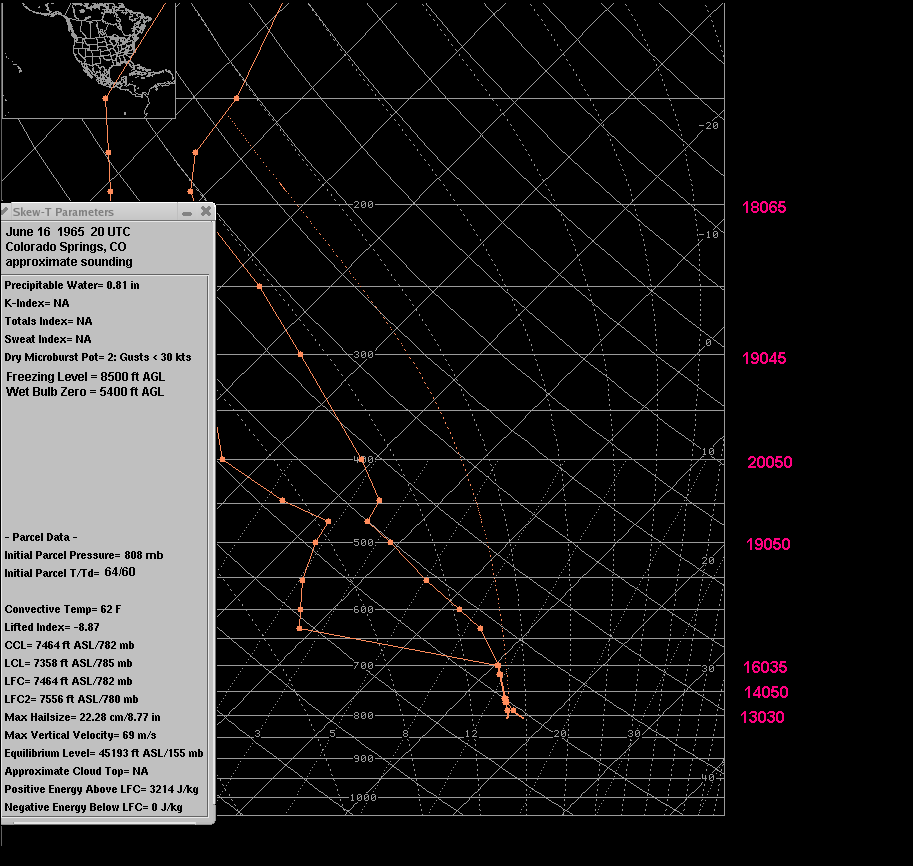
June 16
Very strong upslope flow on the 16th resulted in very high surface dewoints along the
front range from Las Vegas, NM to
Pueblo and Colorado Springs. On
June
16, 1965
several tornadoes occurred along and west of the urban
corridor in Colorado. On this day, hail to golfball size and
greater occurred at
Holman, NM (elev. 7800 ft) which is 32 miles northwest of Las
Vegas
in
the foothills of the southern Rockies. Hail to 1.5" fell at Black
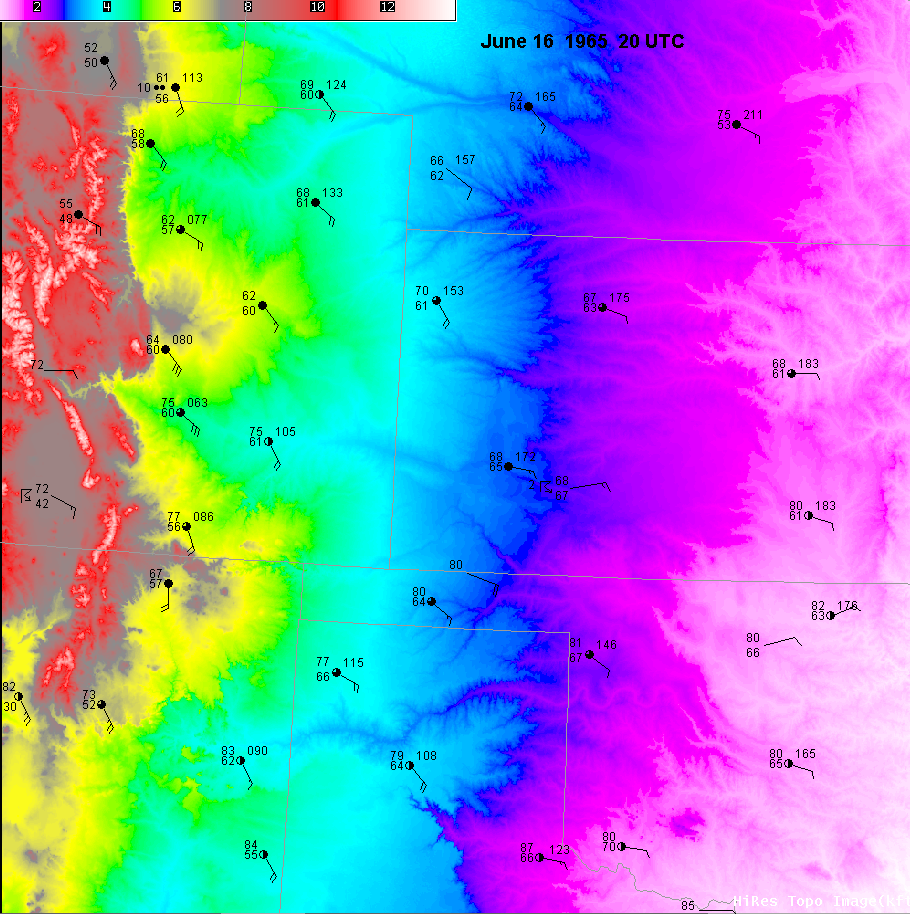
Lake NM (elev. 8600 ft). I plotted the 20 UTC surface
observations on a
terrain map as well.
The
20
UTC surface map
showed strong
southeast
winds advecting moisture onto
the front range. The T/TD at Colorado Springs (elevation
6180 ft.) were 64F/60F.
At Dallas
the dewpoint was 70F. But since
a 60F dewpoint at COS has the same amount
of moisture as a 66F dewpoint
at Dallas,
the mixing ratio at Fort Worth was
only 16% higher than at COS. The surface
temperature at
Dallas was 85F
compared
to 64F at Colorado Springs.
However, the potential temperature was much
higher at Colorado Springs--96.9F
versus 85.8F.
Therefore, the surface
theta-e was higher at COS(351.6K versus
350.8K). Even though COS and Vichy(VIH) had about
the same T/TD, the
theta-e was much
higher at COS owing
to a MUCH higher
potential temperature and somewhat
higher mixing ratio.
The theta-e at COS
was also higher than at
Dodge City, mostly
due to the huge difference
in potential temperature.
| 20 UTC |
Elev(ft) |
Pres.(mb) |
SLP(mb) |
T(F) |
Td(F) |
MR(g/kg) |
theta(F) |
theta-e(K) |
| Las Vegas |
6800 |
788 |
1004 |
72 |
53 |
10.6 |
110.5 |
350.4 |
| Vichy, MO |
1000 |
980 |
1020.5 |
73 |
52 |
8.5 |
76.1 |
323 |
| Colo. Springs |
6140 |
808 |
1008.0 |
64 |
60 |
13.9 |
96.9 |
351.6 |
| Dodge City |
2600 |
927 |
1017.4 |
68 |
67 |
15.5 |
79.5 |
345.0 |
| Dallas |
487 |
994 |
1015.2 |
85 |
70 |
16.1 |
85.8 |
350.8 |
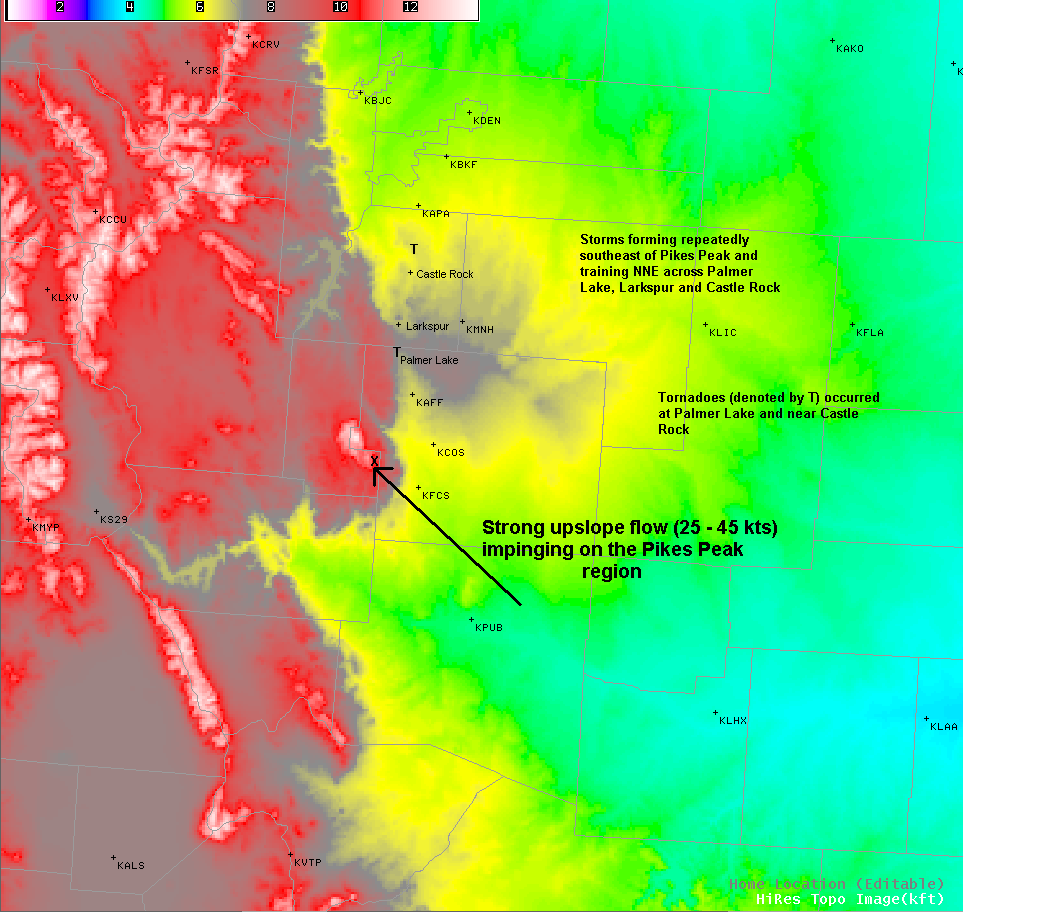
Here is an
terrain map with a depiction of the strong
upslope on the windward side of Pikes Peak and the training of storms to the N/NNE
that lead to 6" to
14" rain amounts in
Larkspur, Palmer Lake and south of Castle Rock.
Creeks in the region flooded and
caused major flooding in Denver with
$250,000,000 damage. The
700mb flow was backed to the sse in the morning. Its is obvious
from this 700mb chart that the warm sector extends only as far
north as southern Wyoming. This limited the northern
extent of
severe weather that day. The
850mb chart showed backed
winds along the high plains with rich moisture. The 500-200mb
flow had
become more meridional with the
leading edge along the
front range at 12 UTC.
500mb,
400mb,
300mb and
200mb.
The 500mb
charts at 12Z
and 00Z featured southerly flow up and down the
western high plains.
The evening (00 UTC)
sounding from Denver was convectively contaminated. The 00 UTC June
17
500mb,
400mb,
300mb and
200mb charts still
showed the leading edge of the stronger flow along the front
range. The
700mb chart featured strong 30-40kt flow
from New Mexico into Colorado. The
approximate
sounding
for Colorado Springs at 20 UTC shows about 3200 j/kg surface based
CAPE.
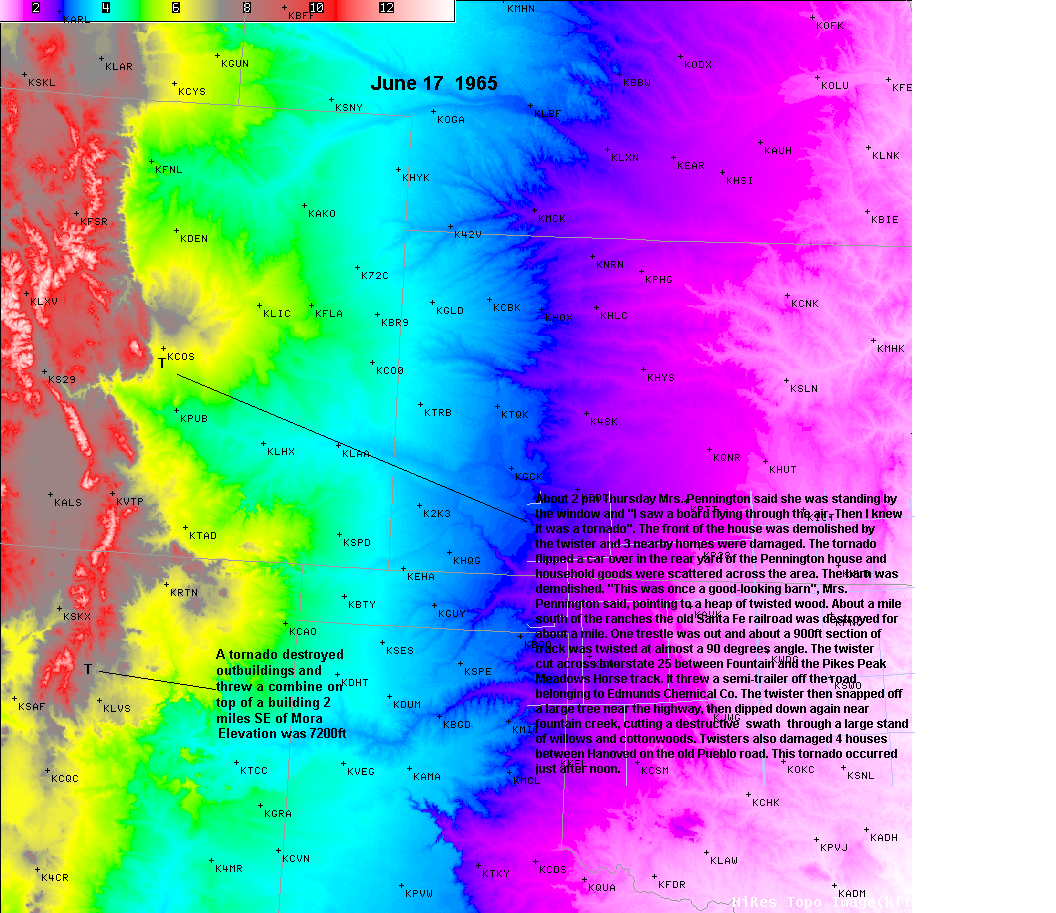
June 17
On
June
17, 1965 several tornadoes occured along the front range in Colorado. Howling upslope flow at 30 to 40kts resulted in
extremely high
surface dewpoints at Colorado Springs. The T/TD at Pueblo was
72F/66F at
18
UTC.
This is about as high
as
the dewpoint ever gets at 4700ft. In fact, a 66F dewpoint at Pueblo has
nearly the same mixing ratio as a 71F dewpoint at
Dallas, TX.
The T/Td at Dallas and Port Arthur were 83F/71F and 87F/72F
respectively.
The
theta-e was higher at Pueblo
than at Dallas and Port Arthur despite the much lower temperature. The
mixing ratio was about the same at all 3 locations. So
elevated heating
was crucial. Despite the T/TD being 20F/14F lower at
LVS compared to Port Arthur, the theta-e was
still slightly higher at Las Vegas.
| 18 UTC |
Elev(ft) |
Pres.(mb) |
SLP(mb) |
T(F) |
Td(F) |
MR(g/kg) |
theta(F) |
theta-e(K) |
| Las Vegas |
6800 |
795
|
1012
|
67 |
58 |
13.2 |
102.6 |
353.1 |
| Pueblo |
4726 |
856.7 |
1013.6 |
72 |
66 |
16.2 |
96 |
358.2 |
| Port Aurthur |
20 |
1017.0 |
1017.8 |
87 |
72 |
16.8 |
84.4 |
352.2 |
| Dallas |
487 |
1002.9 |
1020.1 |
83 |
71 |
16.5 |
82.6 |
350.0 |
A topographic
map with surface observations at 19 UTC can be found here.
The 12 UTC
500mb chart showed fairly strong (50 to 60 kts) flow with cool
temperatures (-10 to -12C). The upper flow was still
meridional with the
400,
300 and
200mb jet axis from western AZ into Utah and western WY.
700mb temperatures had cooled off to 7C at Denver
since the moist
layer deepened. Of course, this cooling was partly diurnal in
nature.
The approximate sounding for Pueblo for 18 UTC June 17 shows 4400 j/kg CAPE.
By 21 UTC on
June 17, 1965,
just before a tornado hit at 7300 ft elevation near Mora, NM, the
theta-e at Las Vegas was up to
356.9K. The theta-e at
Tulsa was MUCH lower despite the temperature being 9F higher and
dewpoint 1F higher. The mixing
ratio at Tulsa was
much lower than at Las Vegas even though Tulsa's dewpoint was higher.
The theta-e was higher
in
Las Vegas than at
Port Arthur even though the temperature was 18F lower and dewpoint 14F
lower.
| 21 UTC |
Elev(ft) |
Pres.(mb) |
SLP(mb) |
T(F) |
Td(F) |
MR(g/kg) |
theta(F) |
theta-e(K) |
| Las Vegas |
6800 |
793
|
1009
|
72 |
58 |
13.2 |
108.4 |
356.9 |
| Tulsa |
670 |
997.5 |
1021.7 |
81 |
59 |
10.8 |
81.4 |
332 |
| Pueblo |
4726 |
853.7 |
1009 |
81 |
63 |
14.6 |
106 |
360 |
| Houston |
60 |
1013.4 |
1015.8 |
88 |
75 |
18.7 |
86 |
359 |
| Port Arthur |
20 |
1014.7 |
1015.8 |
90 |
72 |
16.8 |
84.4 |
352.2 |
| Waco |
500 |
998.5 |
1016.6 |
93 |
65 |
13.4 |
93.2 |
347.9 |
The
approximate sounding for Las Vegas for 21 UTC June 17 showed 3600 j/kg CAPE.
The 00 UTC
June 18th upper air charts showed fairly strong mid to high level flow(
500,
400,
300,
200mb) along the front range.
700mb
temps were still +12 to +13C in Colorado and New Mexico.