Back to Boulder Area Tornadoes Webpage
Back to Albuquerque Area Tornadoes WebpageJune 14
Late on June
13 and early on June 14, 1965, low level upslope flow pushed moisture onto the front range. Two frontal
boundaries
were present by the 22 UTC June 14. The northern front extended from southern Colorado across Oklahoma
and Arkansas.
The southern front extended up and down the front range into New
Mexico and Texas. Very unstable
conditions
existed along the length of the front range with the highest
instability further north in Colorado and Wyoming.
The 00z June
15 500mb chart showed a deep trough in the western US with
moderate mid level flow as far east as
the front
range of Colorado. The 6km flow (close to 400mb at Denver) was 40kts, which is fairly strong by eastern
Colorado
standards in mid June. It was fairly cold aloft for mid June with 400mb
temperatures from -22 to -24C and
300mb temps from -38C to -40C. 700mb temps were 15C at Albuquerque, +13C at Denver and slightly cooler further
north in
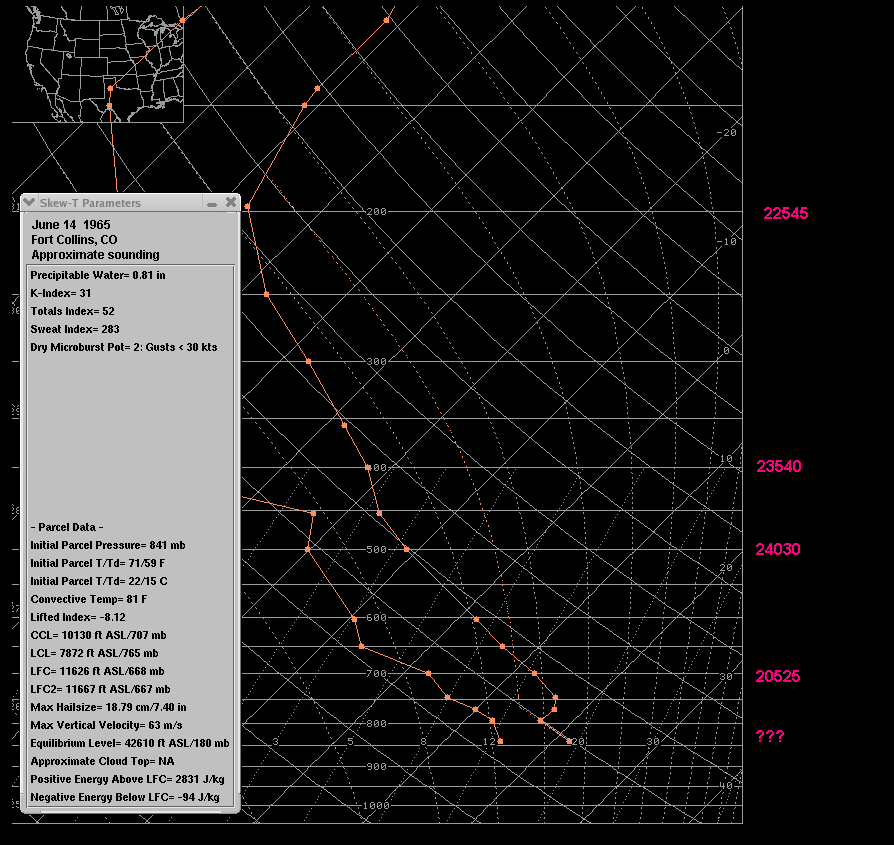
Wyoming. Approximate soundings for Douglas, WY and Fort Collins,
CO show moderate to high surface based
CAPE from 2500
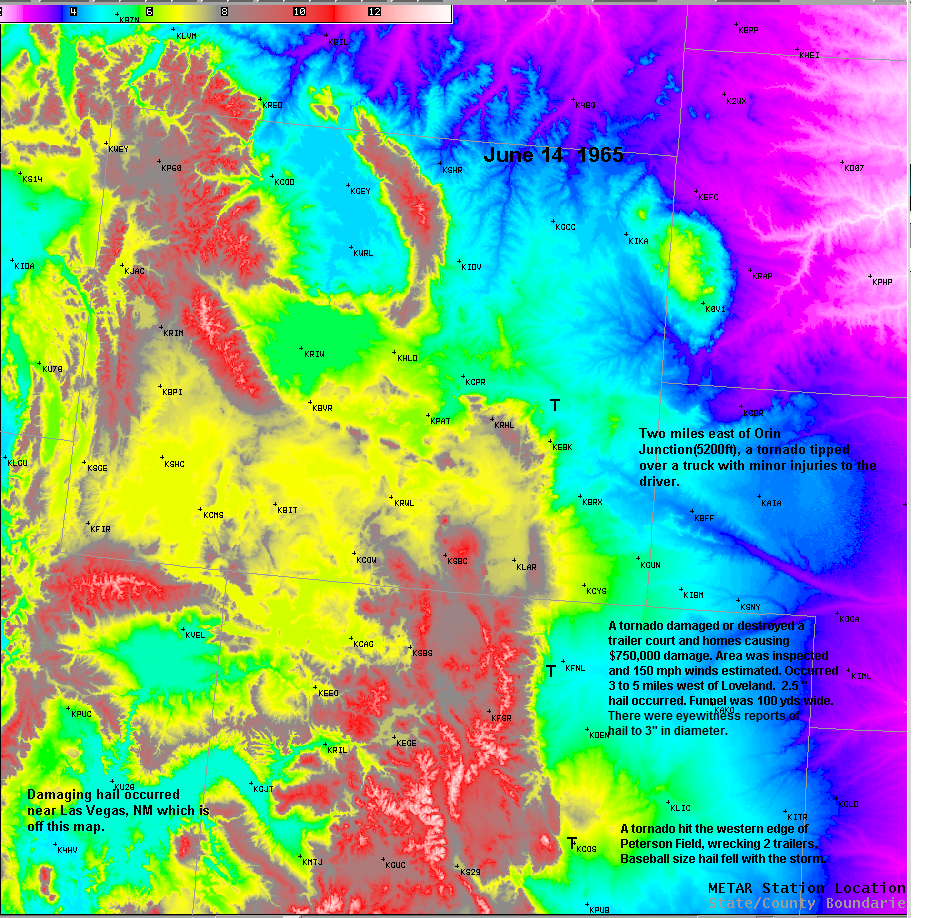
to 3500 j/kg. Tornadoes occurred 3 to 5 miles west of Loveland and southeast of Douglas, WY.
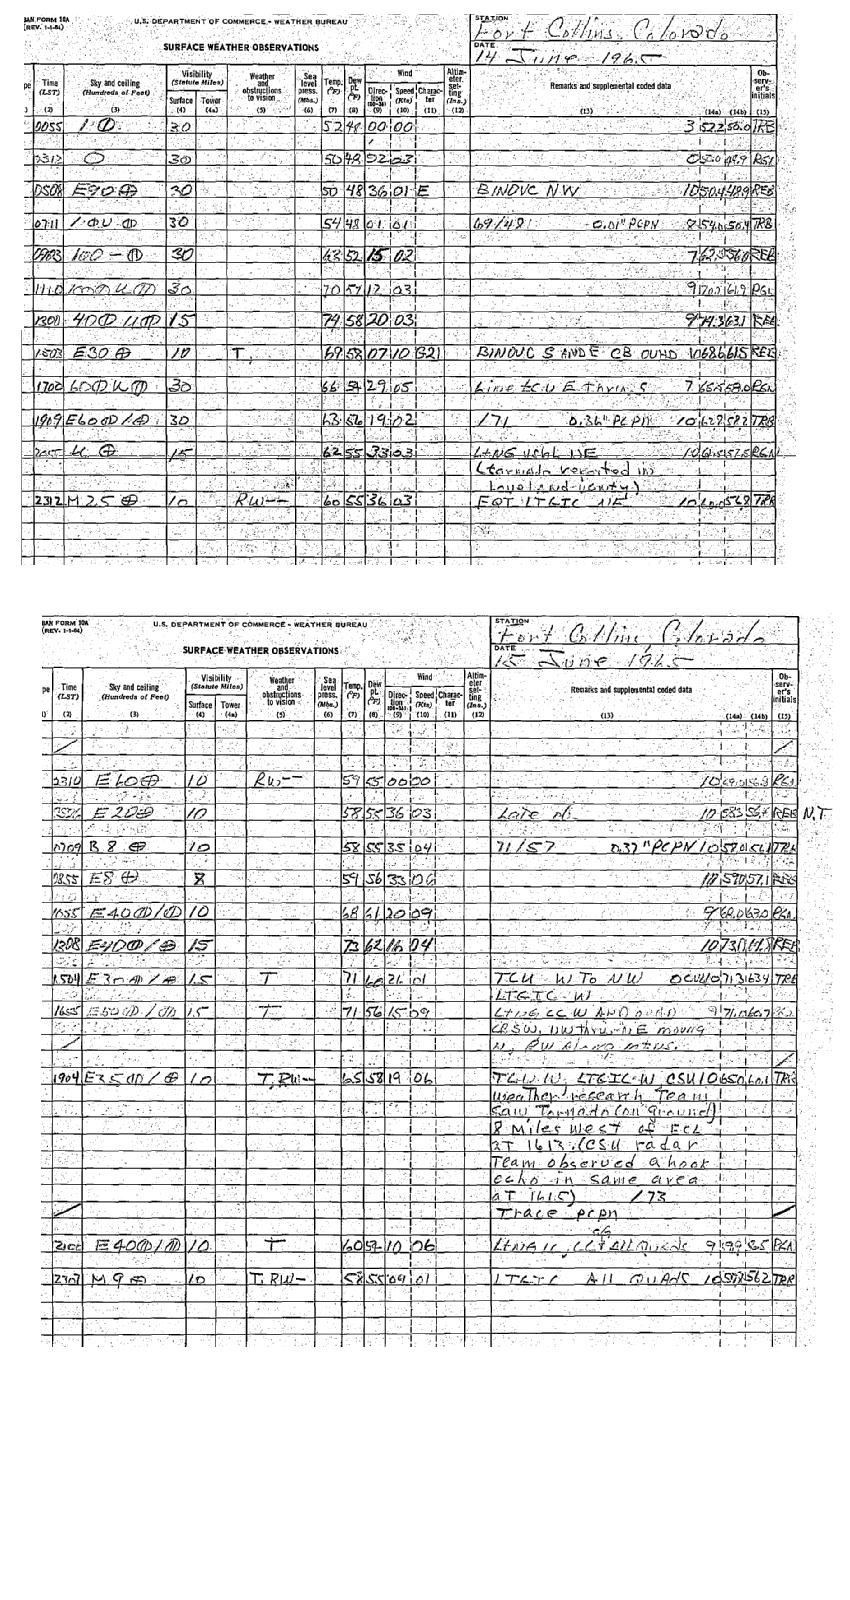
The surface observation form from Fort Collins makes reference to the the tornado that occurred west of Loveland that
lasted for 15 minutes.
The
approximate sounding for Fort Collins showed 2800 j/kg surface based CAPE. The capping
inversion was
obviously much weaker in
the foothills and mountains southwest of Fort Collins where
the storm developed.
The
storm probably
initiated on the edge of the mountains west or southwest of Loveland.
Given the sw to wsw mid
level
flow, the storm
probably moved to the ene or east.
The other upper air charts are 850mb 700mb 200mb
The theta-e was higher at Las Vegas than at Chanute even though the T/TD were 4F/19F higher at Chanute. This is because
| 22 UTC | Elev(ft) | Pres.(mb) | SLP(mb) | T(F) | Td(F) | MR(g/kg) | theta(F) | theta-e(K) |
| Las Vegas | 6800 | 788 | 1002 | 71 | 47 | 8.8 | 108.3 | 343.4 |
| Colo. Springs | 6140 | 806.8 | 1004 | 75 | 57 | 12.5 | 108.9 | 355.0 |
| Denver |
5300 | 830 | 1003.6 | 73 | 55 | 11.3 | 102 | 347.0 |
| Chanute | 950 | 975 | 1010 | 75 | 66 | 14.2 | 78.9 | 340.9 |
| Mcalester | 487 | 988 | 1007.6 | 86 | 70 | 16.2 | 87.9 | 352.6 |
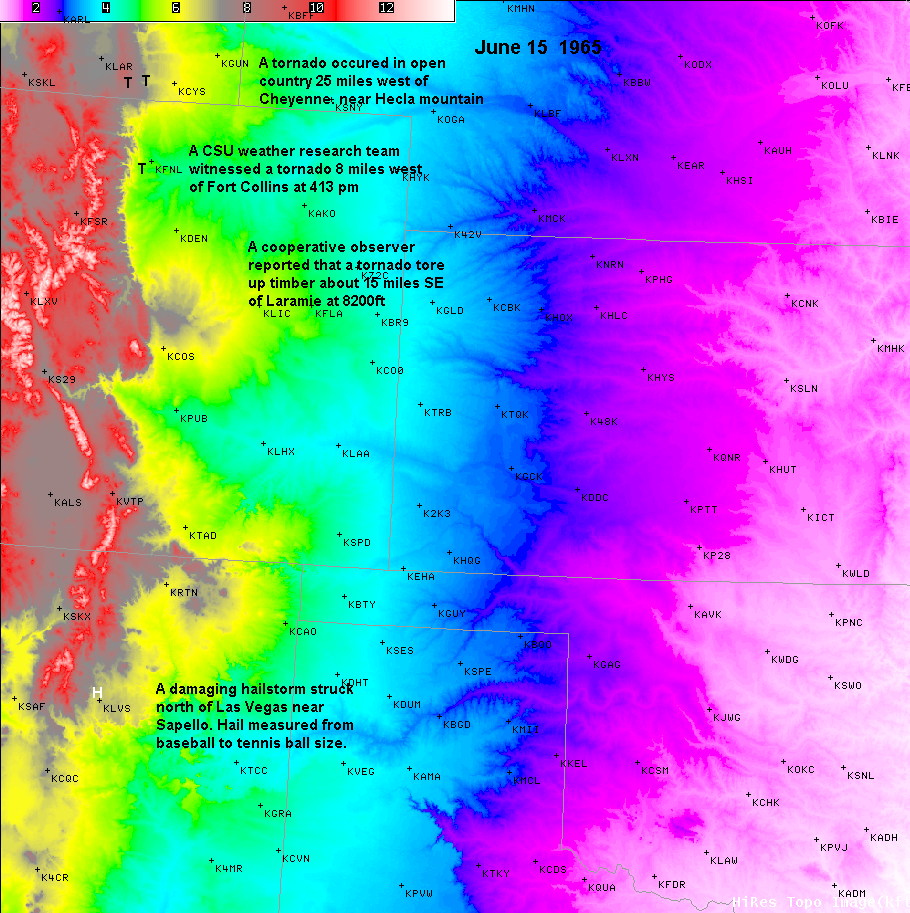
On June
15, 1965 , a tornado was observed by a weather research team at Colorado State University. The surface
observation sheet from Fort Collins indicated that a weather research team witnessed a tornado 8 miles west of
Fort Collins
at 413 pm.
A major hailstorm occurred in the northern suburbs of
Las Vegas, NM and Sapello, NM with hail up to 3" in diameter.
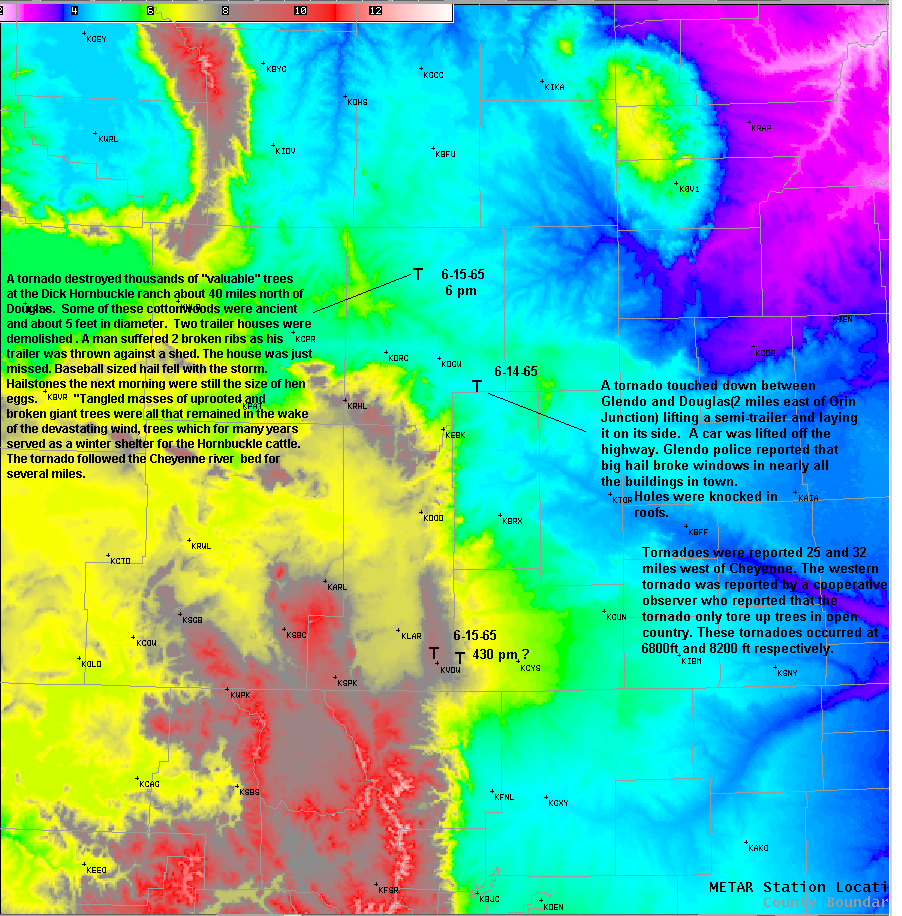
A tornado
occurred 32 miles west of Cheyenne (elev. 8200ft) or about 15 miles
southeast of Laramie, tearing up some
timber, but
hitting no structures. Another tornado occurred 25 miles
west of Cheyenne.
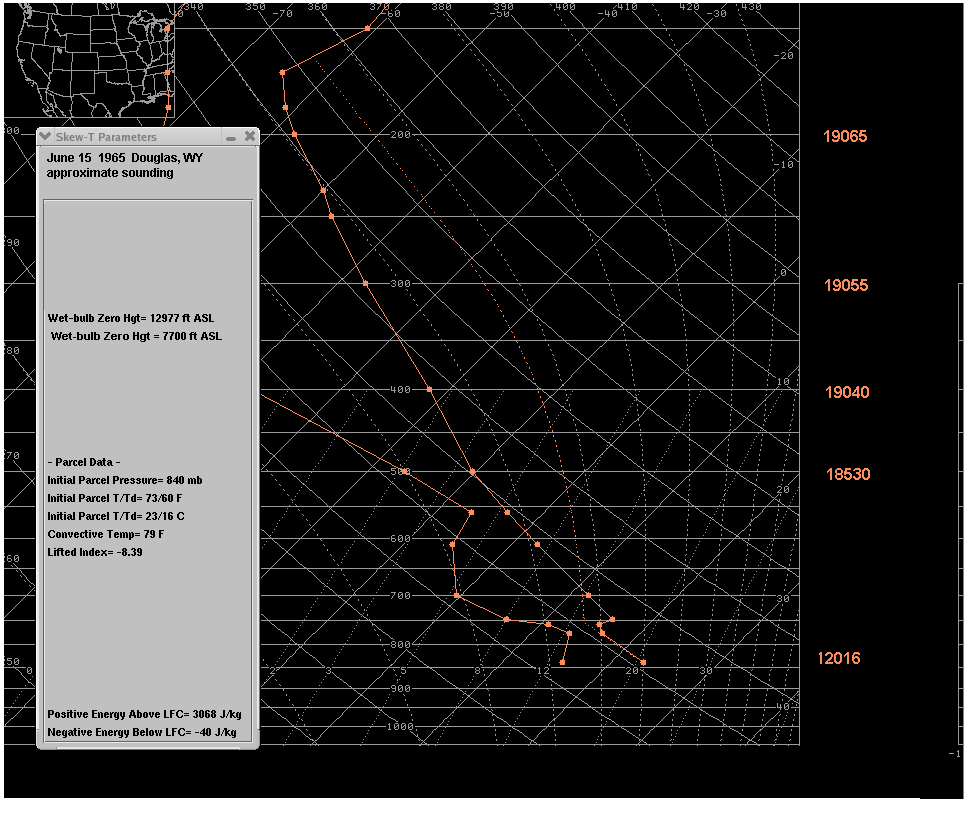
A tornado and baseball sized hail occurred about 40 miles north of Douglas near the Cheyenne river. This tornado
is not
listed in any storm databases. The surface observations at Douglas, WY are here. My approximate sounding
for Douglas,
WY during the late afternoon shows about 3000 j/kg surface based CAPE.
Of course the shear was good
with ese low
level winds veering to the south or southwest with increasing speeds.
The wet-bulb zero was around 7700ft AGL.
The 19 UTC surface chart showed 2
areas of moist upslope flow--one in New
Mexico and the other in northeast Colorado
back to the
front range.
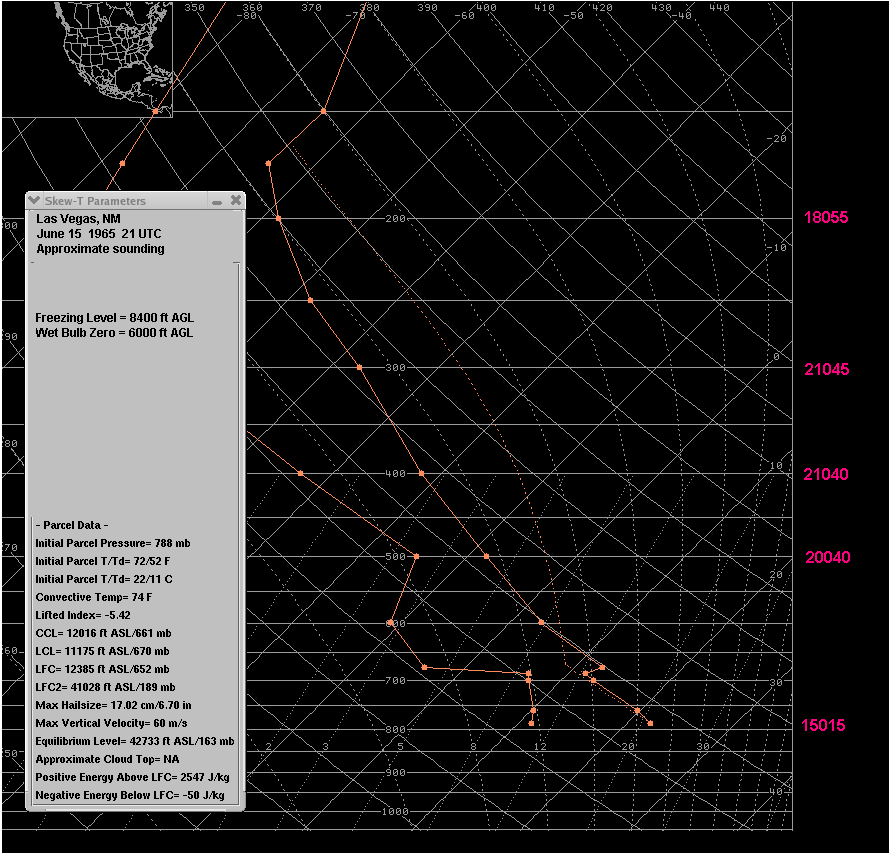
The approximate sounding for Las Vegas, NM for 21 UTC showed 2500 j/kg CAPE, with a freezing level of 8400 ft AGL
and web-bulb zero height of 6000 ft AGL.
The T/TD
were 18F and 13F higher at Tulsa compared to
Las Vegas but the theta-e was slightly higher at Las Vegas. The
T/TD
were 9F/12F lower at Denver compared to Ardmore but the theta-e was slightly higher at Ardmore. The potential
temperature at
Santa Fe was 111F. This makes up for the lack of moisture(mixing ratio
9.5 g/kg) as the theta-e was higher than
at Tulsa
(T/TD of 84F/66F). So even though the mixing ratio was 47% lower
at Santa Fe, and the temperature 8F lower
than at Tulsa, the theta-e was actually higher at Santa Fe
since the potential temperature was 111F.
| 19 UTC | Elev(ft) | Pres.(mb) | SLP(mb) | T(F) | Td(F) | MR(g/kg) | theta(F) | theta-e(K) |
| Santa Fe | 6350 | 800 | 1002 | 76 | 49 | 9.5 | 111.2 | 346.9 |
| Las Vegas | 6760 | 789 | 1004 | 66 | 53 | 11 | 102.8 | 346.7 |
| Denver |
5300 | 830 | 1003.4 | 75 | 60 | 13.5 | 104.2 | 355.3 |
| Mcalester | 487 | 988 | 1010.8 | 86 | 70 | 16.2 | 85.8 | 353 |
| Tulsa | 600 | 988 | 1011.9 | 84 | 66 | 14 | 86.9 | 345.6 |
| Ardmore | 750 | 983 | 1009.9 | 83 | 72 | 17.4 | 85.7 | 354.8 |
| Waco | 500 | 990 | 1007.8 | 92 | 67 | 14.5 | 93.6 | 351.4 |
| 00 UTC | Elev(ft) | Pres.(mb) | SLP(mb) | T(F) | Td(F) | MR(g/kg) | theta(F) | theta-e(K) |
| Laramie | 7200 | 772 | 1000 | 66 | 53 | 11.2 | 106.3 | 349.7 |
| Las Vegas | 6800 | 789 | 1004 | 60 | 57 | 12.8 | 96.6 | 348.1 |
| Mcalester | 487 | 984 | 1010.1 | 81 | 71 | 16.8 | 83.5 | 351.5 |
| Tulsa | 600 | 987 | 1011.9 | 82 | 66 | 14 | 86.9 | 343 |
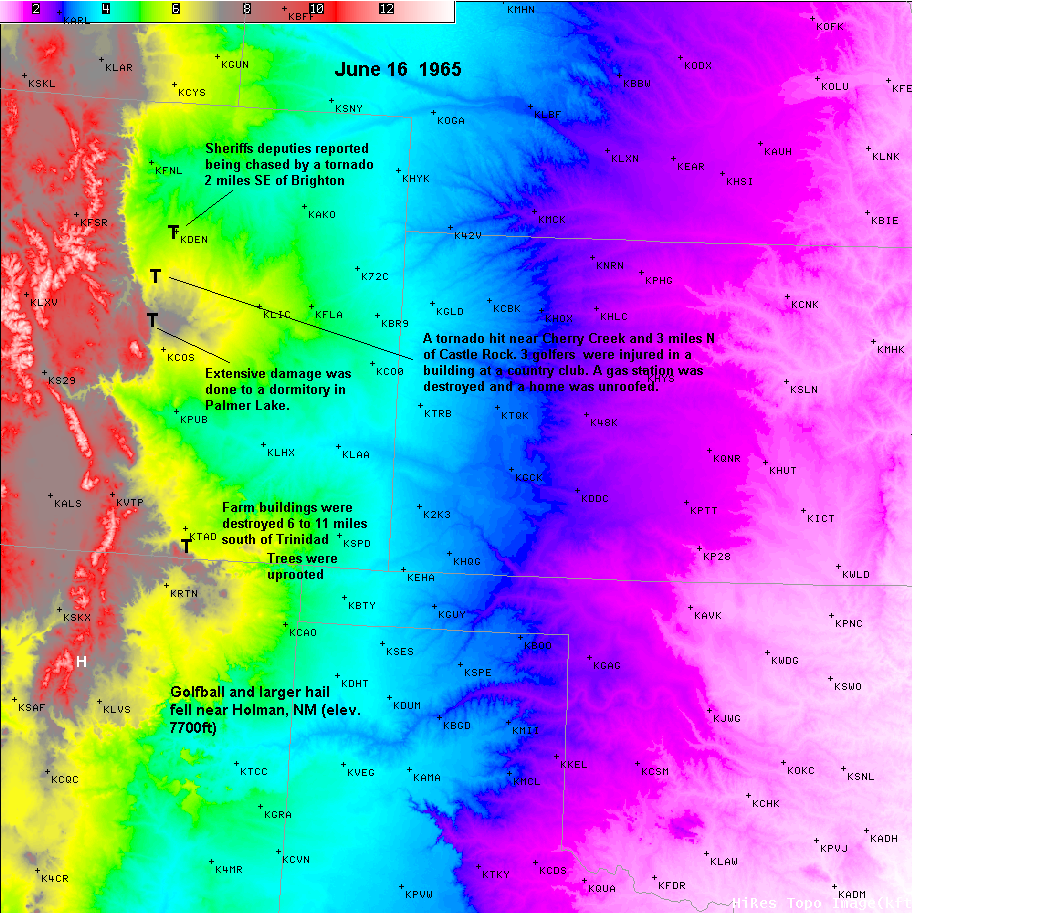
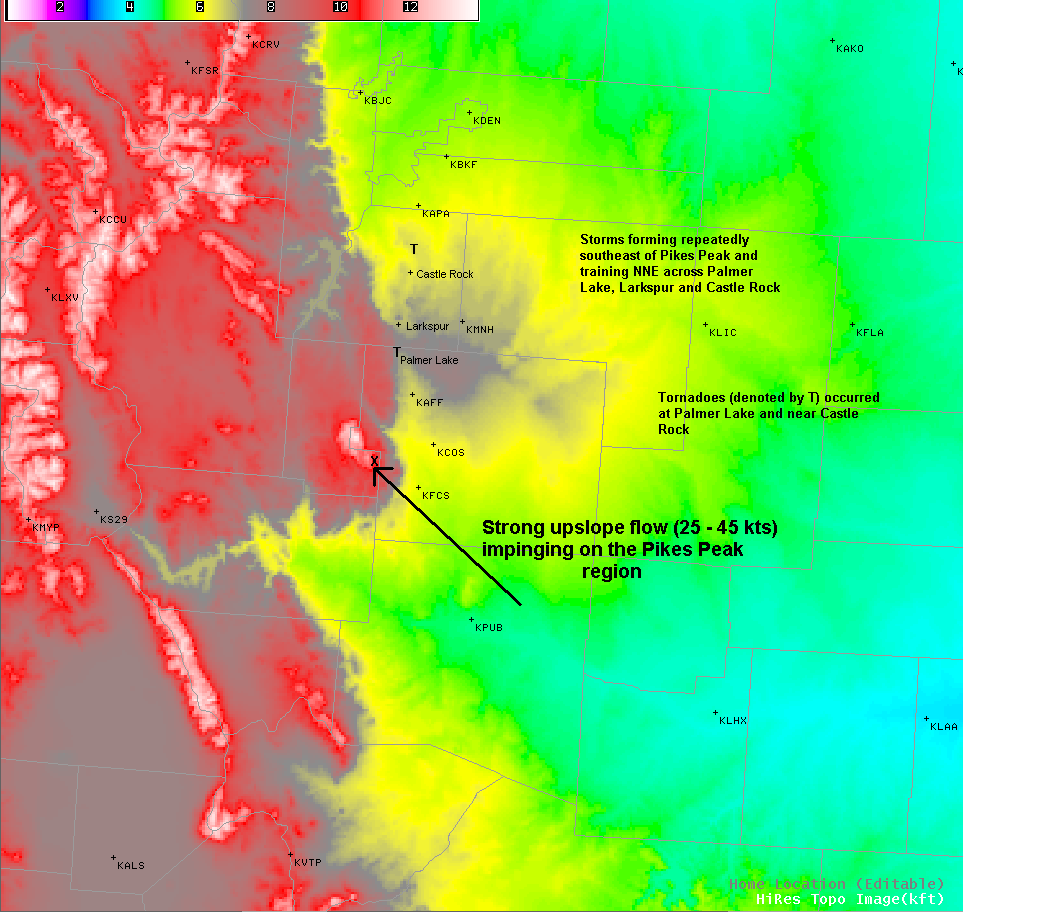
Very strong upslope flow on the 16th resulted in very high surface dewpoints along the
front range from Las Vegas, NM
to Pueblo and Colorado Springs. On June
16, 1965 several tornadoes occurred along and west of the urban
corridor in
Colorado. On this day, hail to golfball size and
greater occurred at
Holman, NM (elev. 7800ft) which is 32 miles northwest
of Las Vegas
in
the foothills of the southern
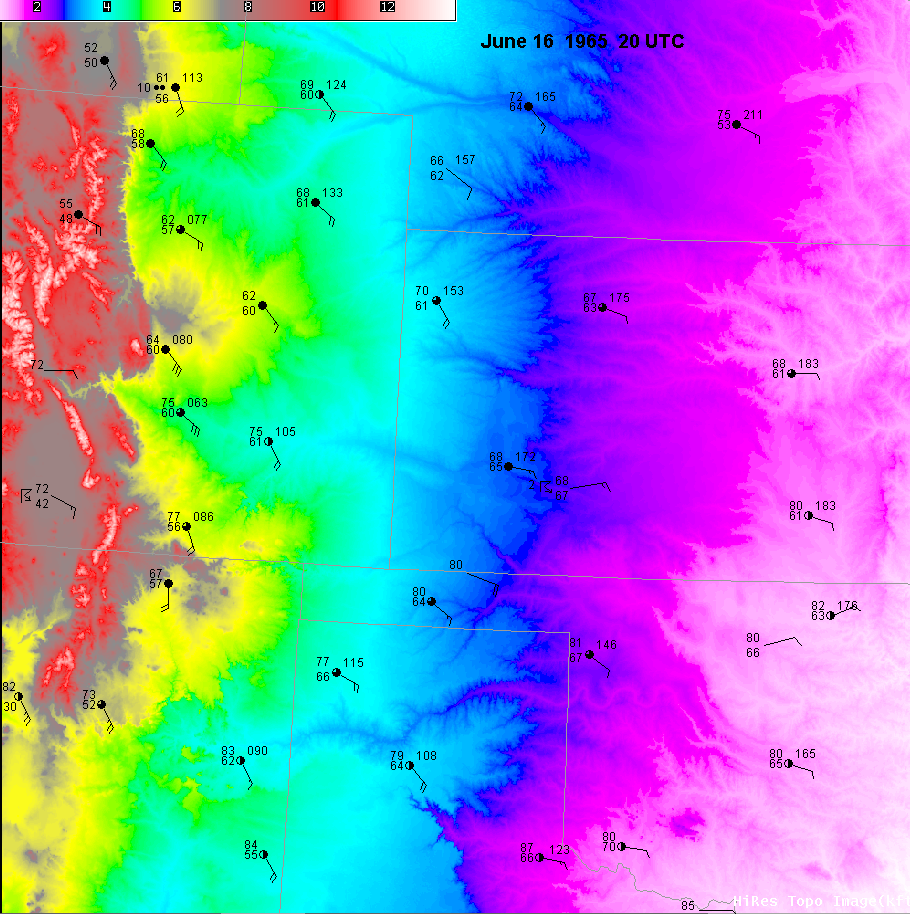
Rockies. Hail to 1.5" fell at Black Lake NM (elev. 8600 ft). I plotted the
20 UTC surface
observations on a terrain map as well. The 20
UTC surface map
showed strong
southeast
winds advecting
moisture onto
the front range. The T/TD at Colorado Springs(elevation
6180 ft.) were 64F/60F.
At Dallas
the dewpoint was
70F. But since
a 60F dewpoint at COS has the same amount
of moisture as a 66F dewpoint
at Dallas,
the mixing ratio at
Fort Worth was
only 16% higher than at COS. The
surface temperature at
Dallas was 85F
compared
to 64F at Colorado
Springs.
However, the potential temperature was much
higher at Colorado Springs--96.9F
versus 85.8F.
Therefore, the
surface
theta-e was higher at COS(351.6K versus 350.8K).
The 500mb charts at 12Z
and 00Z
showed southerly flow up
and down the
western high plains.
Even though COS and Vichy(VIH) had about
the same T/TD, the
theta-e was much
higher
at COS owing
to a MUCH higher potential temperature and somewhat
higher mixing ratio.
The theta-e at COS
was also
higher than at
Dodge City, mostly due to the huge difference
in potential temperature. Here is an terrain map with a depiction
of the strong
upslope on the windward side of Pikes Peak and the training of storms
to the N/NNE
that lead to 12 to
14" rain
amounts in
Larkspur, Palmer Lake and south of Castle Rock.
Creeks in the region flooded and
caused major flooding in
Denver with
$250,000,000 damage.
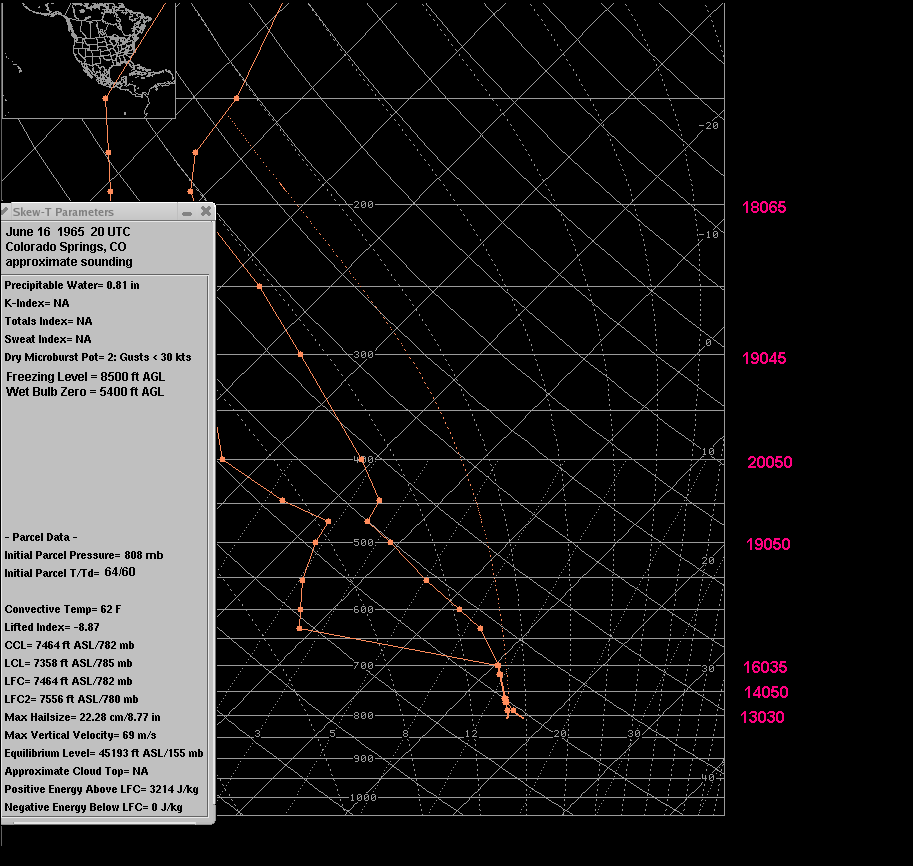
The approximate sounding for Colorado Springs at 20 UTC shows about 3200 j/kg surface based CAPE.
| 20 UTC | Elev(ft) | Pres.(mb) | SLP(mb) | T(F) | Td(F) | MR(g/kg) | theta(F) | theta-e(K) |
| Las Vegas | 6800 | 788 | 1004 | 72 | 53 | 10.6 | 110.5 | 350.4 |
| Vichy, MO | 1000 | 980 | 1020.5 | 73 | 52 | 8.5 | 76.1 | 323 |
| Colo. Springs | 6140 | 808 | 1008.0 | 64 | 60 | 13.9 | 96.9 | 351.6 |
| Dodge City | 2600 | 927 | 1017.4 | 68 | 67 | 15.5 | 79.5 | 345.0 |
| Dallas | 487 | 994 | 1015.2 | 85 | 70 | 16.1 | 85.8 | 350.8 |
| 18 UTC | Elev(ft) | Pres.(mb) | SLP(mb) | T(F) | Td(F) | MR(g/kg) | theta(F) | theta-e(K) |
| Las Vegas | 6800 | 795 |
1012 |
67 | 58 | 13.2 | 102.6 | 353.1 |
| Pueblo | 4726 | 856.7 | 1013.6 | 72 | 66 | 16.2 | 96 | 358.2 |
| Port Aurthur | 20 | 1017.0 | 1017.8 | 87 | 72 | 16.8 | 84.4 | 352.2 |
| Dallas | 487 | 1002.9 | 1020.1 | 83 | 71 | 16.5 | 82.6 | 350.0 |
| 21 UTC | Elev(ft) | Pres.(mb) | SLP(mb) | T(F) | Td(F) | MR(g/kg) | theta(F) | theta-e(K) |
| Las Vegas | 6800 | 793 |
1009 |
72 | 58 | 13.2 | 108.4 | 356.9 |
| Tulsa | 670 | 997.5 | 1021.7 | 81 | 59 | 10.8 | 81.4 | 332 |
| Pueblo | 4726 | 853.7 | 1009 | 81 | 63 | 14.6 | 106 | 360 |
| Houston | 60 | 1013.4 | 1015.8 | 88 | 75 | 18.7 | 86 | 359 |
| Port Arthur | 20 | 1014.7 | 1015.8 | 90 | 72 | 16.8 | 84.4 | 352.2 |
| Waco | 500 | 998.5 | 1016.6 | 93 | 65 | 13.4 | 93.2 | 347.9 |