Related items of interest
Historical Tornado Cases for the Cheyenne Warning Area
Detailed Tornado Cases for the Cheyenne Warning Area
Historical Tornado Cases for the Boulder Warning Area
Historical Tornado Cases for the United States
Elevated Mixed Layer
Elevated Heating
High plains and front range topo maps
Overview
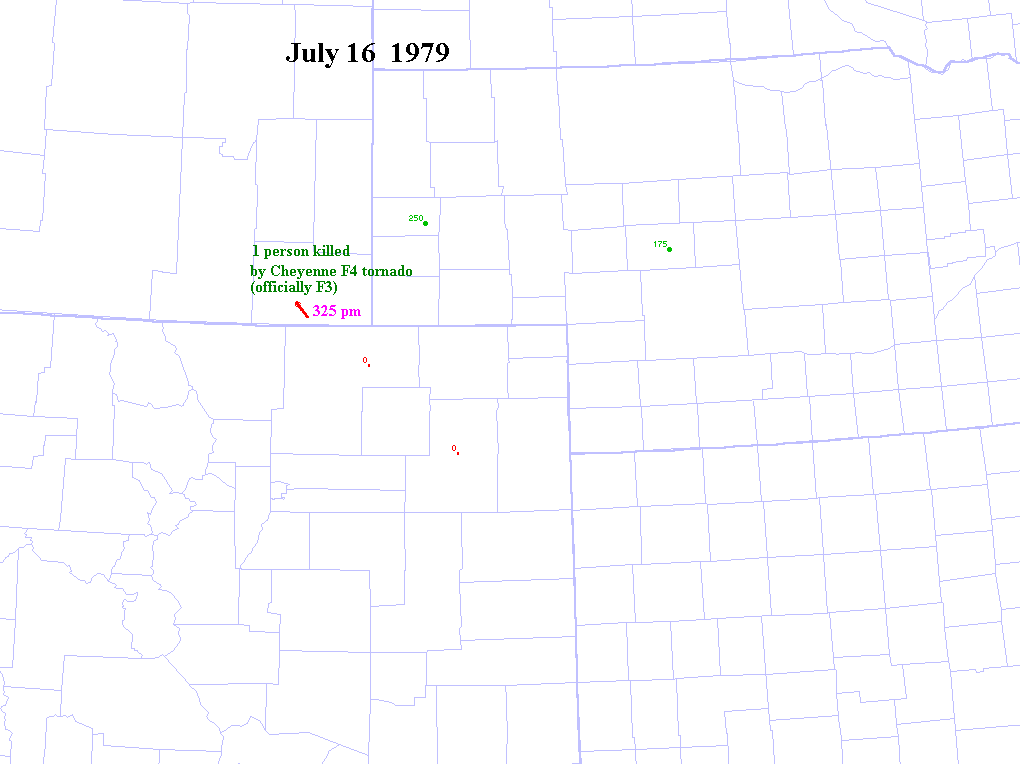
On
July 16, 1979,
the most damaging tornado in Wyoming history touched down 3 miles
west-northwest of the Cheyenne airport. A severe thunderstorm
watch was issued by SELS well before the tornado occurred. The tornado
occurred close to the
severe thunderstorm watch
area. This strong tornado
moved east or east-southeast across the northern part of
Cheyenne, causing $22 million in damage and 1 fatality. 140 houses
and 17 trailers were destroyed. 325 other houses were damaged.
Four C-130 aircraft and National
Guard equipment sustained $12 million damage. Municipal hangars and
buildings suffered another $10 million damage.
There were no hail reports with this storm or any other storm that day
in Wyoming.
A woman was killed instantly by lightning after climbing to the top of Pingora Peak (11884 ft) about 28 miles west of Lander.
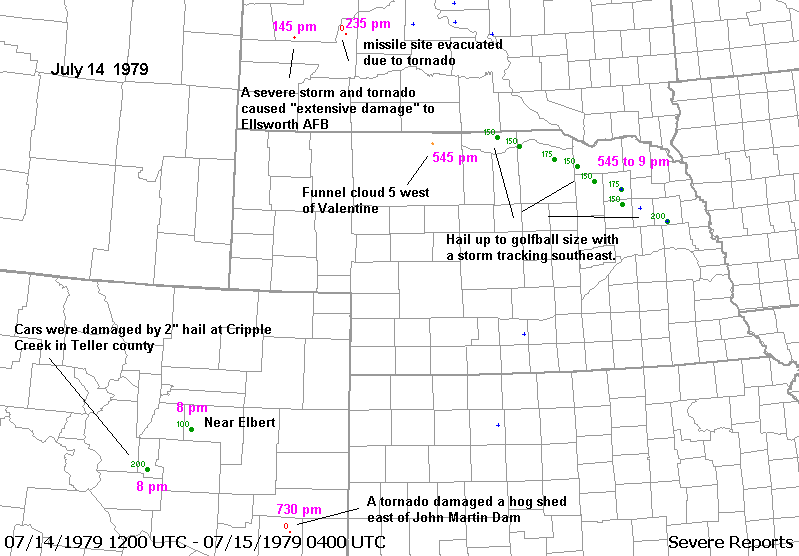
July 14
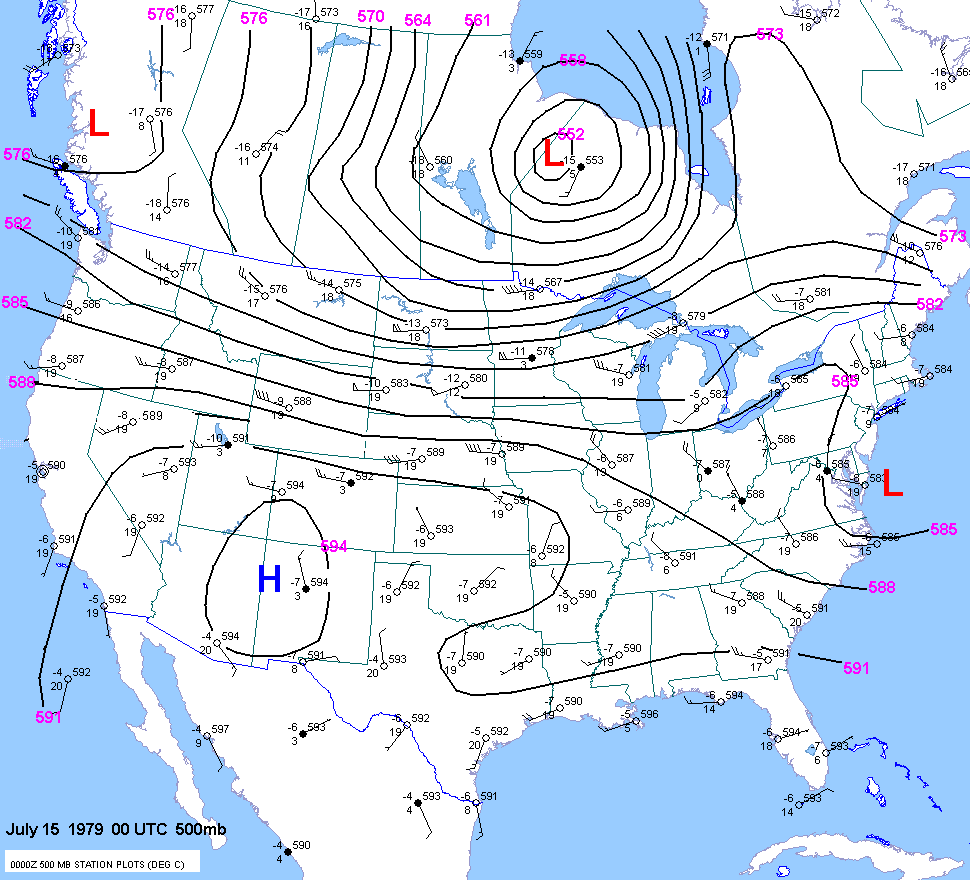
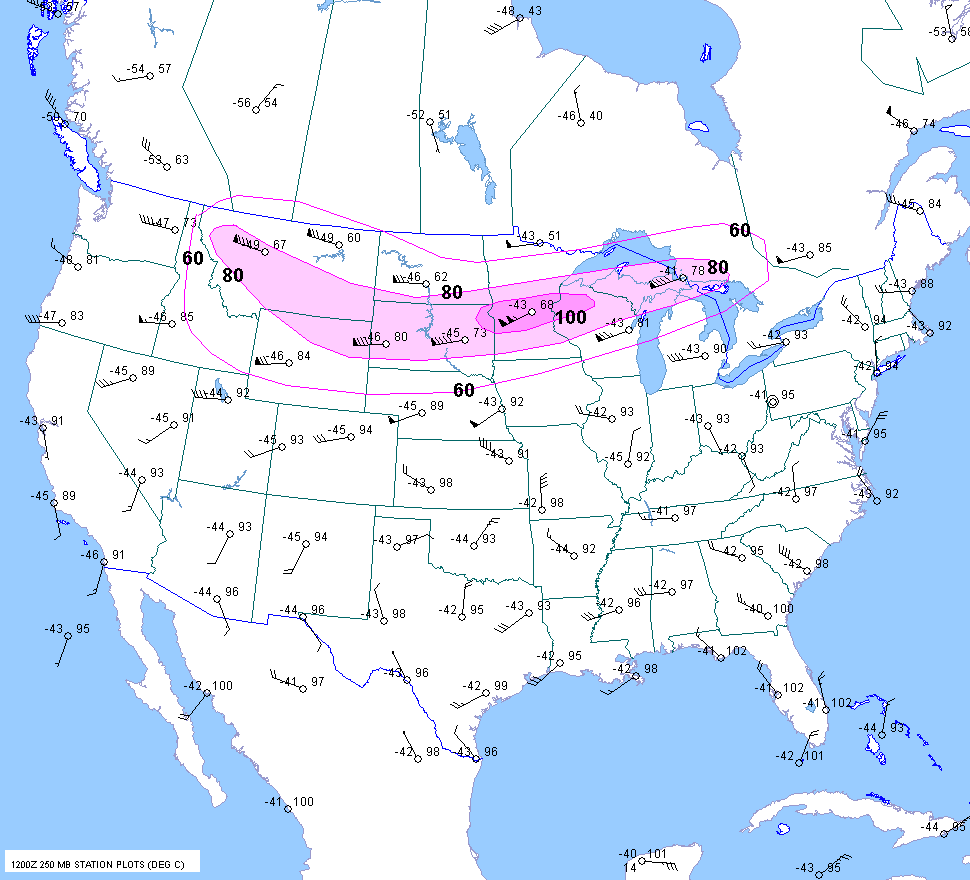
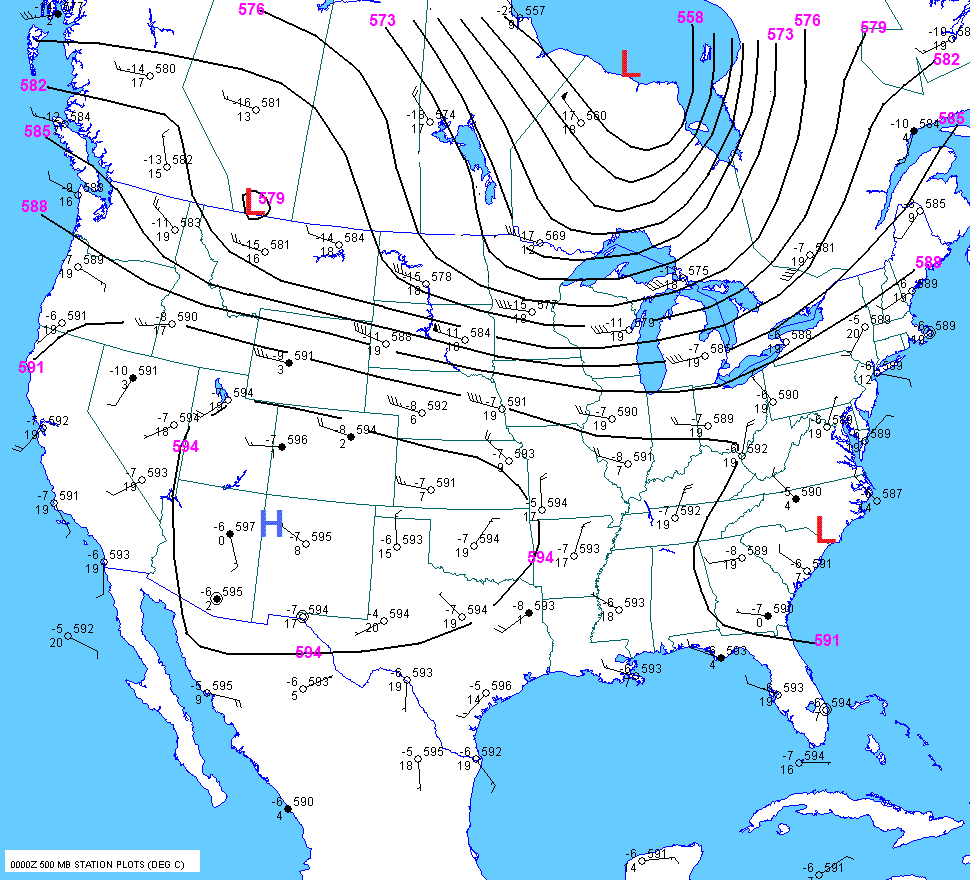
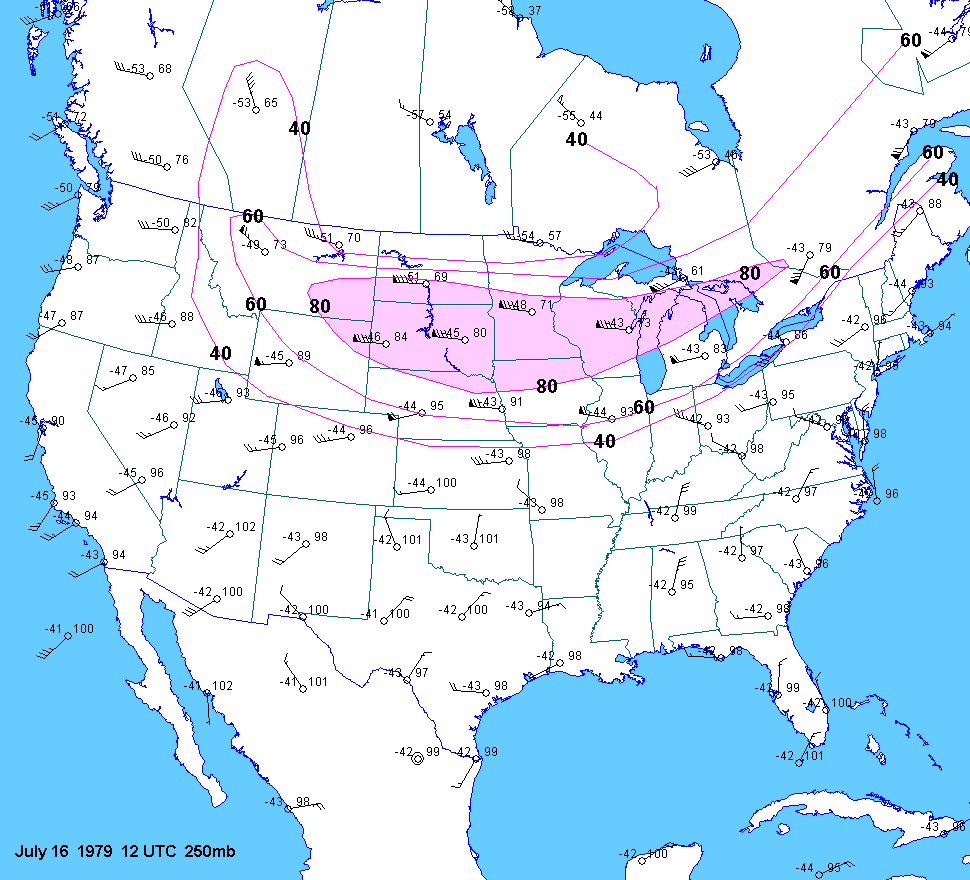
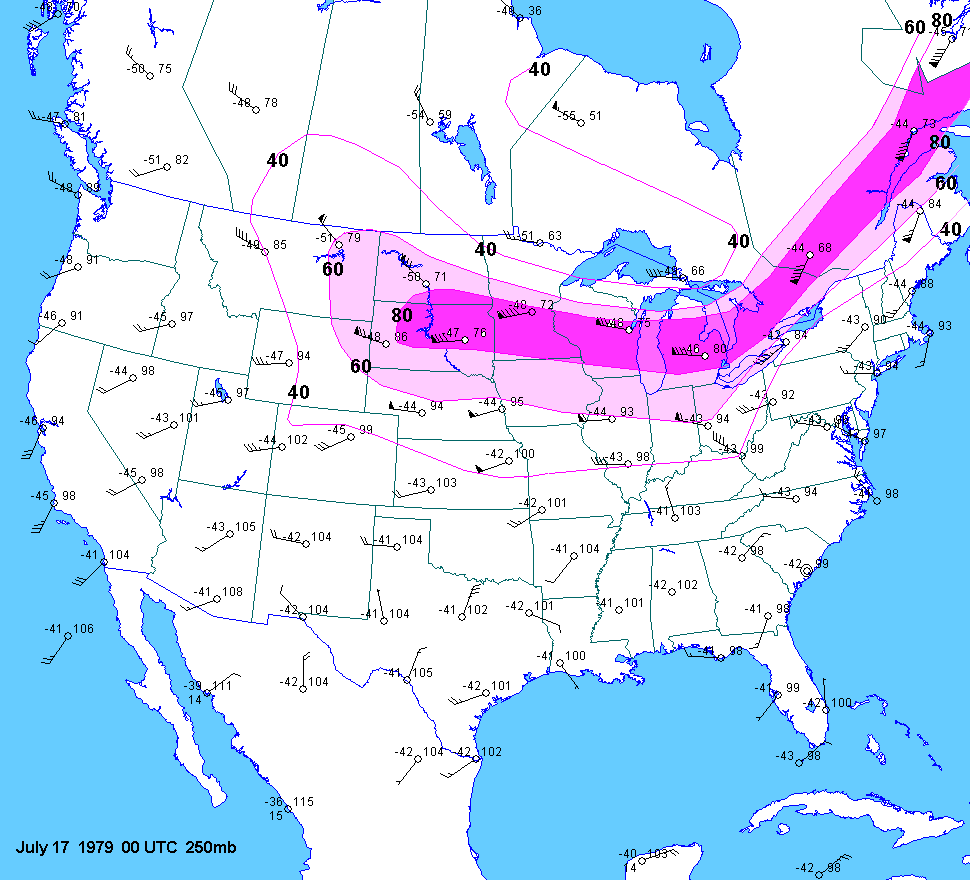
On July 14 a strong shortwave trough and
associated jet streak was moving across the northern plains as shown by the 00 UTC July 15
500mb and
250mb charts. Behind this feature across Wyoming, a cold front was already beginning to surge down the plains as of 21 UTC.
Severe weather actually developed by early afternoon in western SD and Nebraska and in the evening in
Colorado. The warmest part of the
700mb warm plume at 00 UTC July 15 extended from central NM to northern
Colorado into southern Utah and eastern NV. Late on July 14th a cold
surge developed primarily in the lee of the Rockies. By
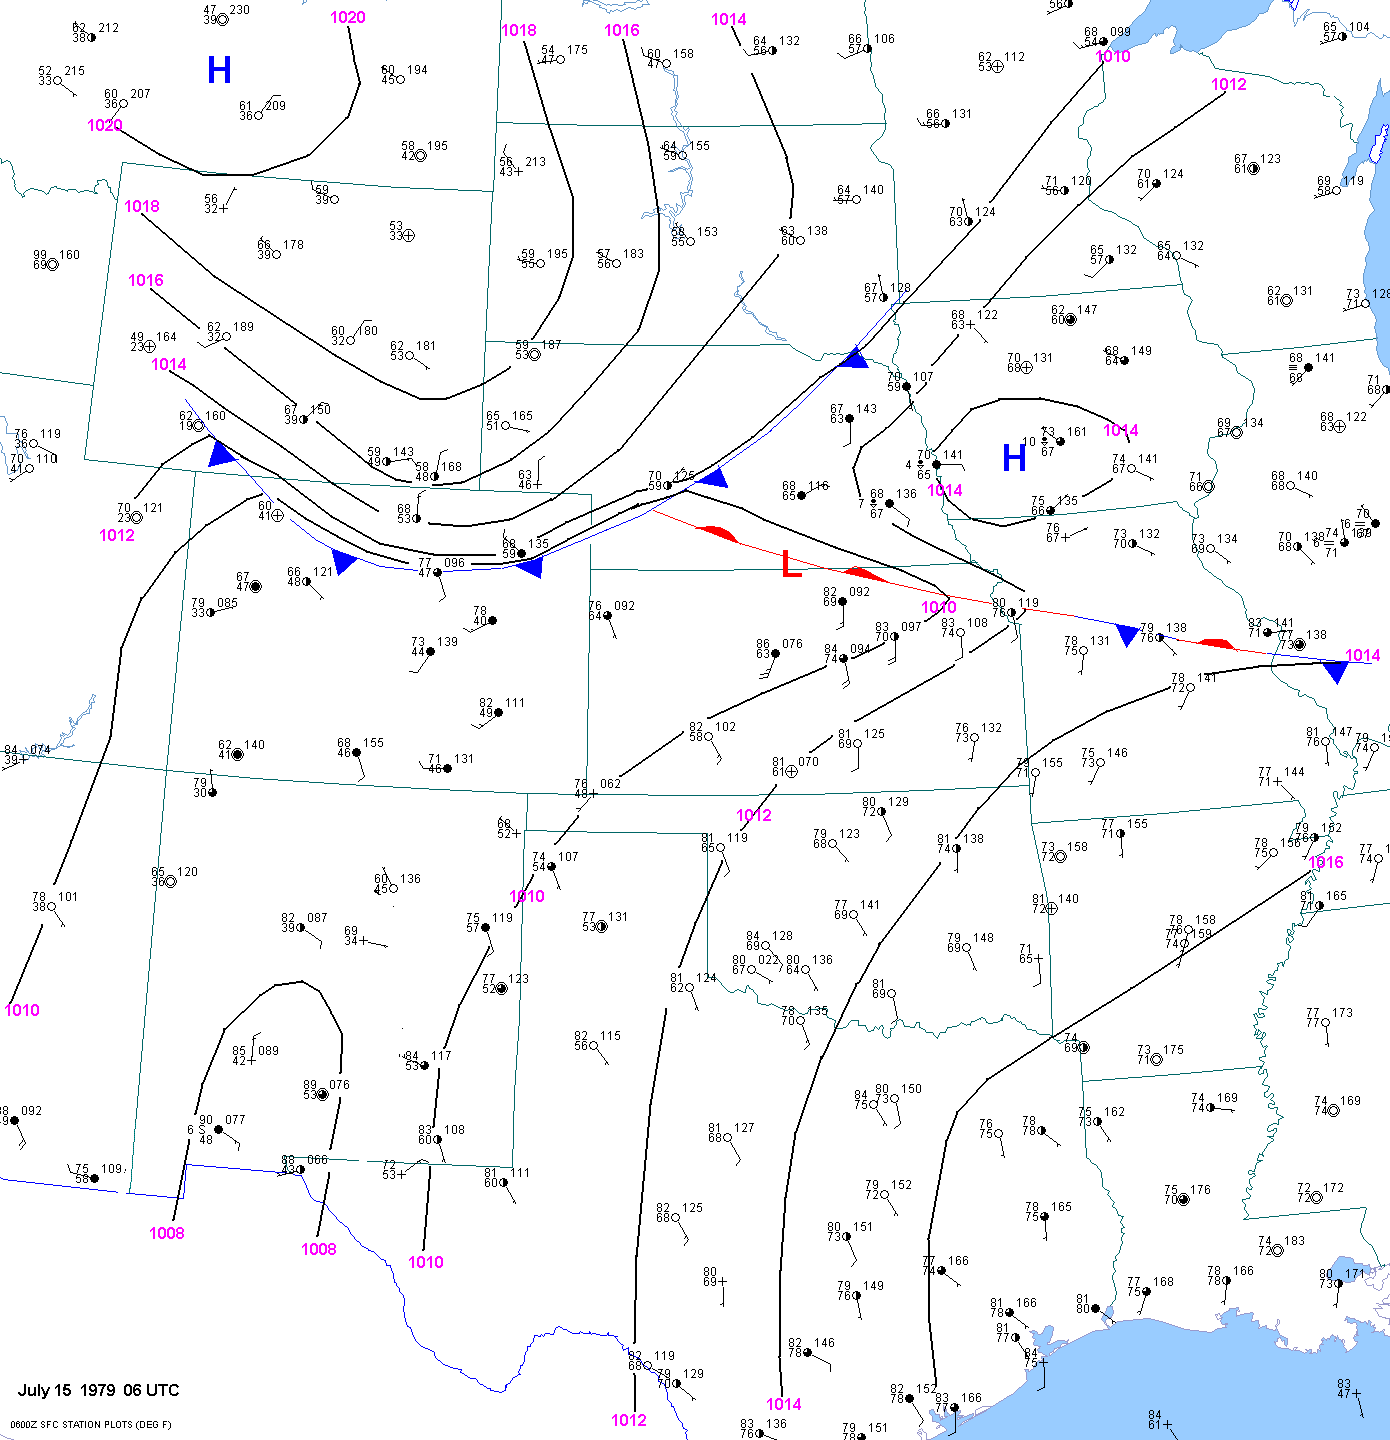
the end of July 14th (
06 UTC July 15th), the cold front had already surged into northern Colorado. A front that was
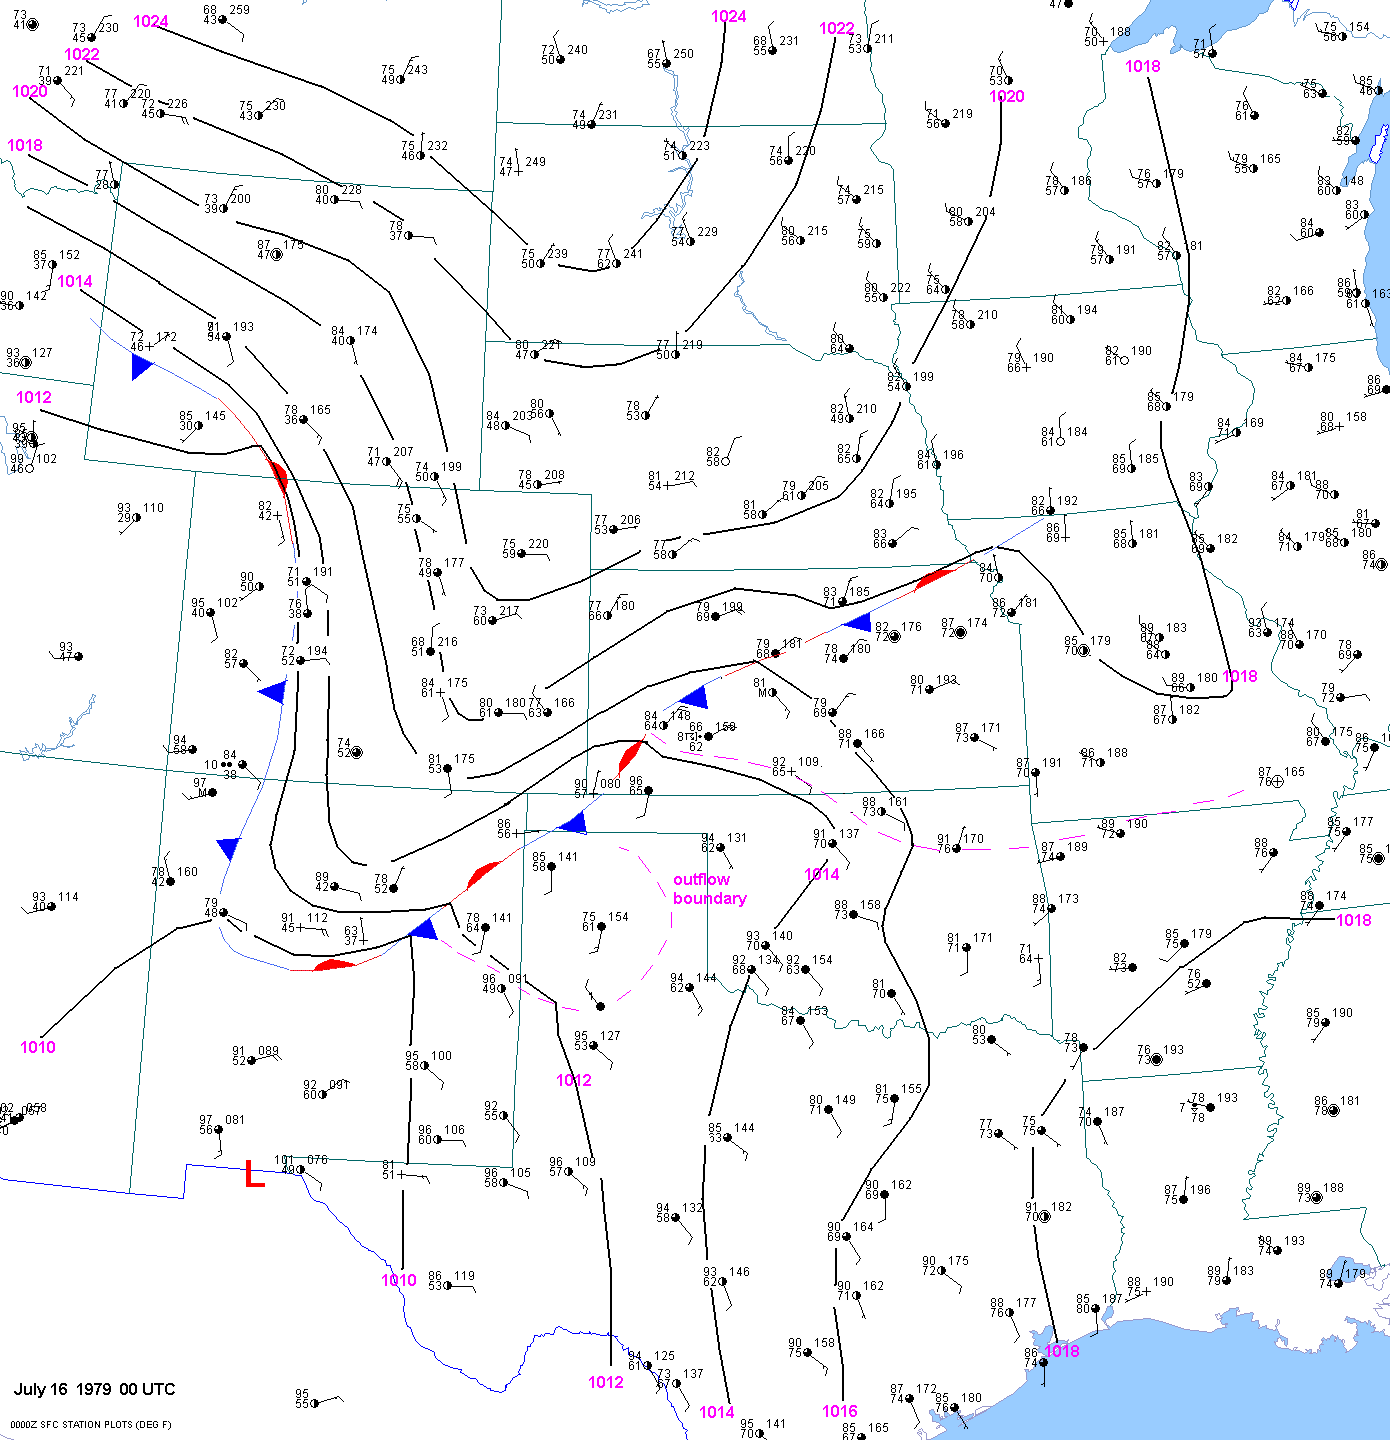
enhanced by outflow was located across southern Nebraska into central Missouri.
July 15
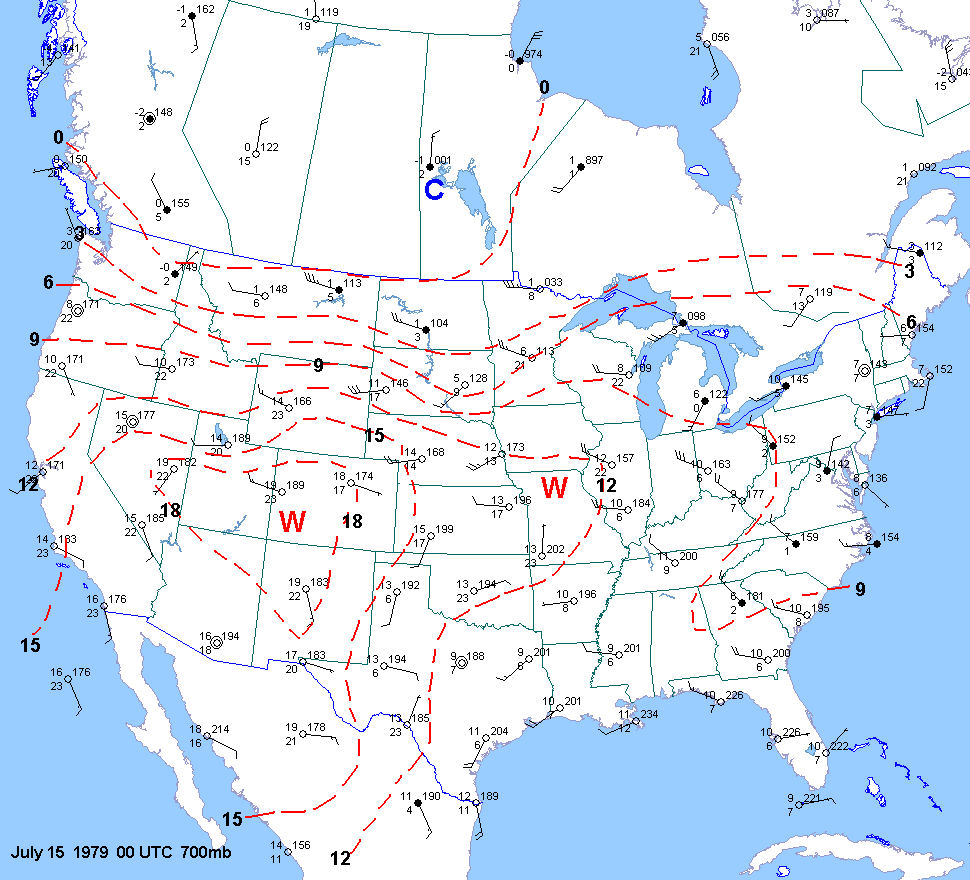
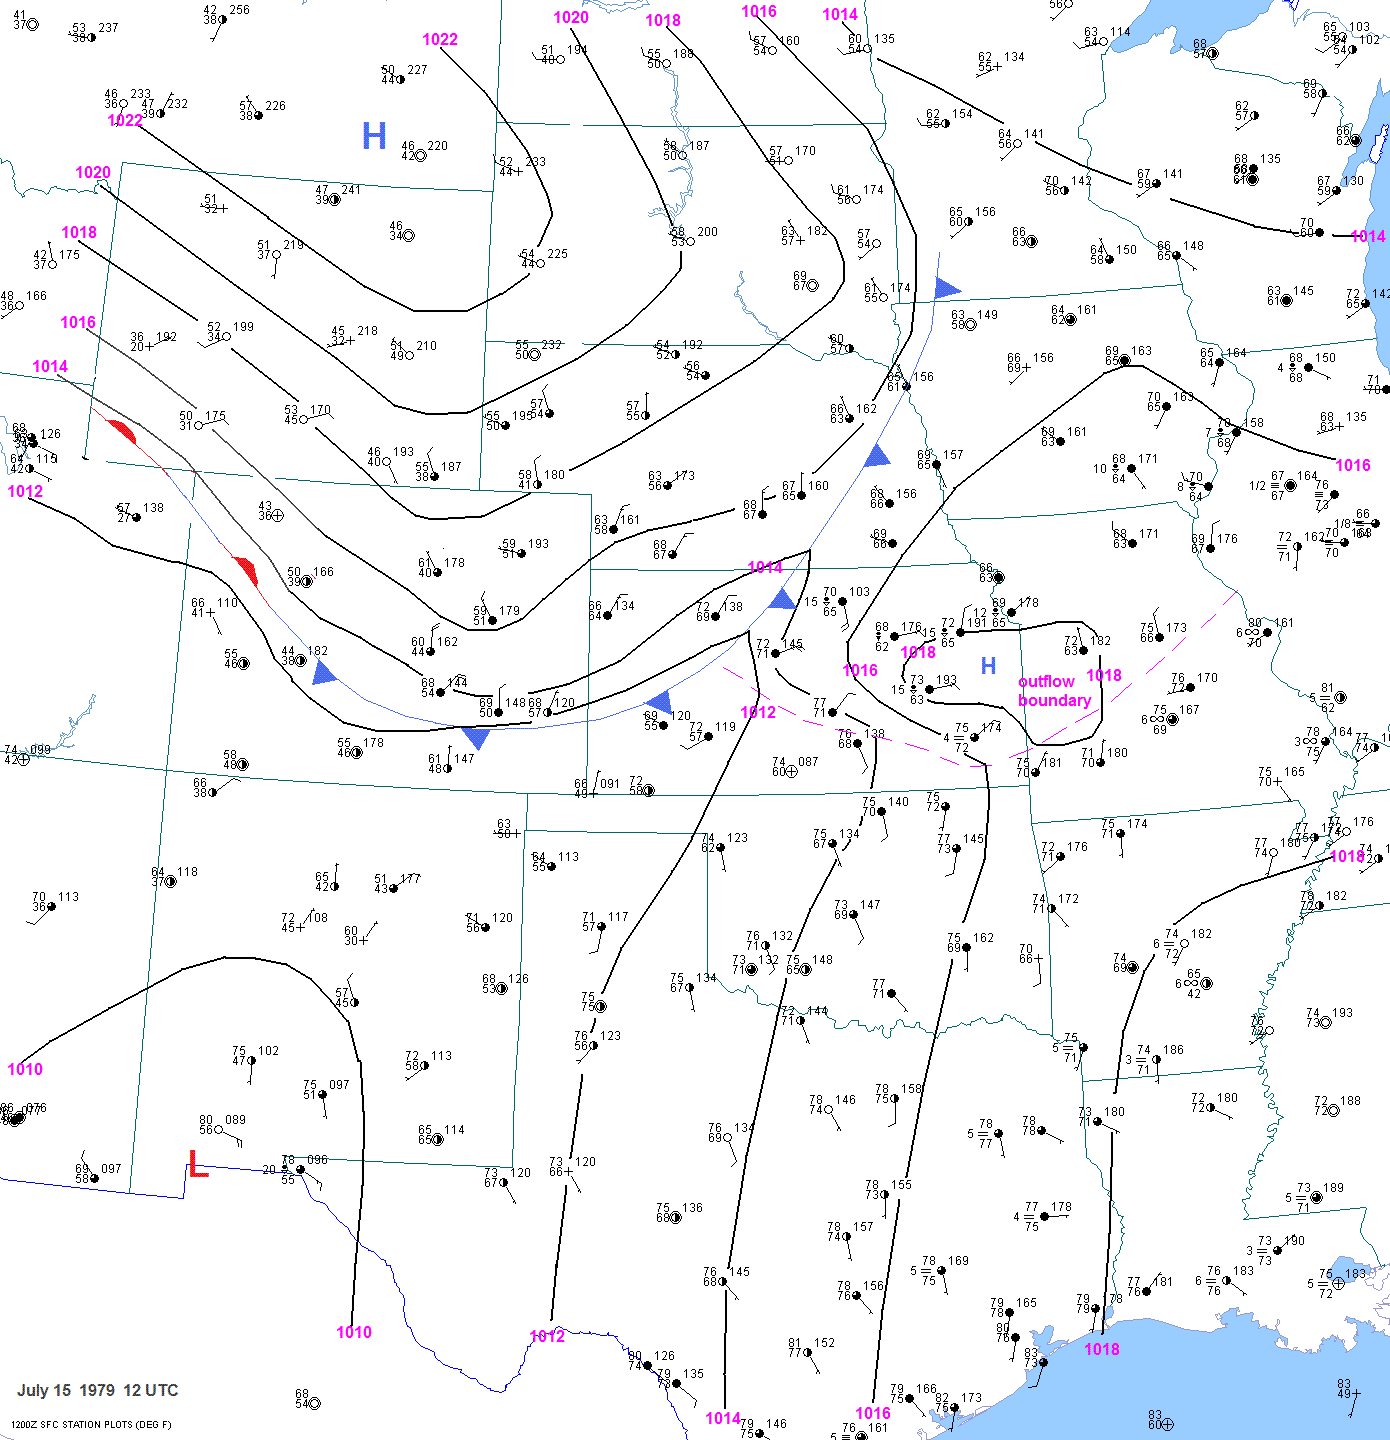
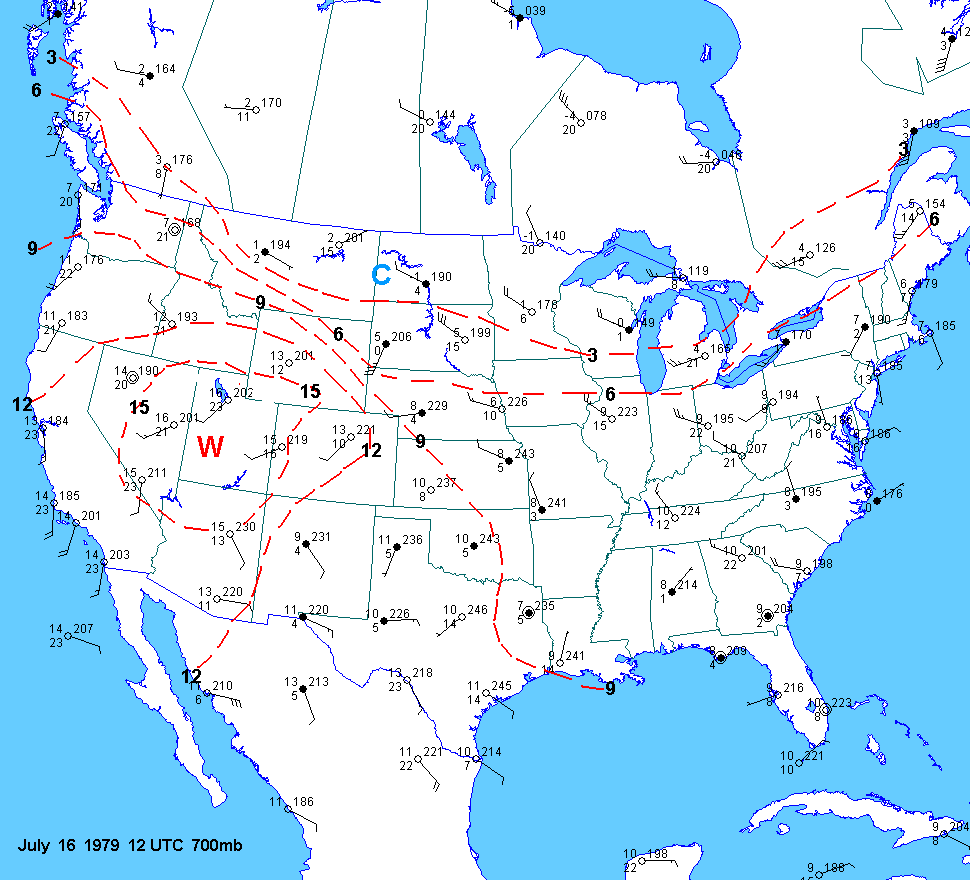
By 12 UTC July 15, the
surface to
700mb cold surge was apparent. The cool air was actually spilling over the Rockies into southwest Wyoming and central CO. The
shortwave trough (
500mb) and associated
jet streak that moved across the northern high plains the
previous evening was located over Minnesota and Iowa. The front that was draped across southern Nebraska and Missouri at
00 UTC July 16 was surging into central Kansas by 12UTC.
By 18 UTC
the front had stalled over western Colorado but was still pushing south
into New Mexico. The outflow boundary that was located over eastern
Kansas and
Missouri at 12 UTC had raced south into northeast Oklahoma and northern
Arkansas.
By
00 UTC
July 16, low-level moisture was beginning to surge upslope (to the
southwest) from northwest Kansas into eastern Colorado. The surface
front was stalling out across central New Mexico. An outflow
boundary stretched from near Dodge City to near Tulsa.
Another cluster of convection in the Texas Panhandle resulted
in ain cooled air at Amarillo. The front in New Mexico
was about to undergo frontolysis since it had already moved to near the
mean ridge position at
500mb. The
northern plains frontal boundary tightened considerably on July 15 as
the elevated mixed layer hot plume shifted north
and the low level cool dome shifted south.
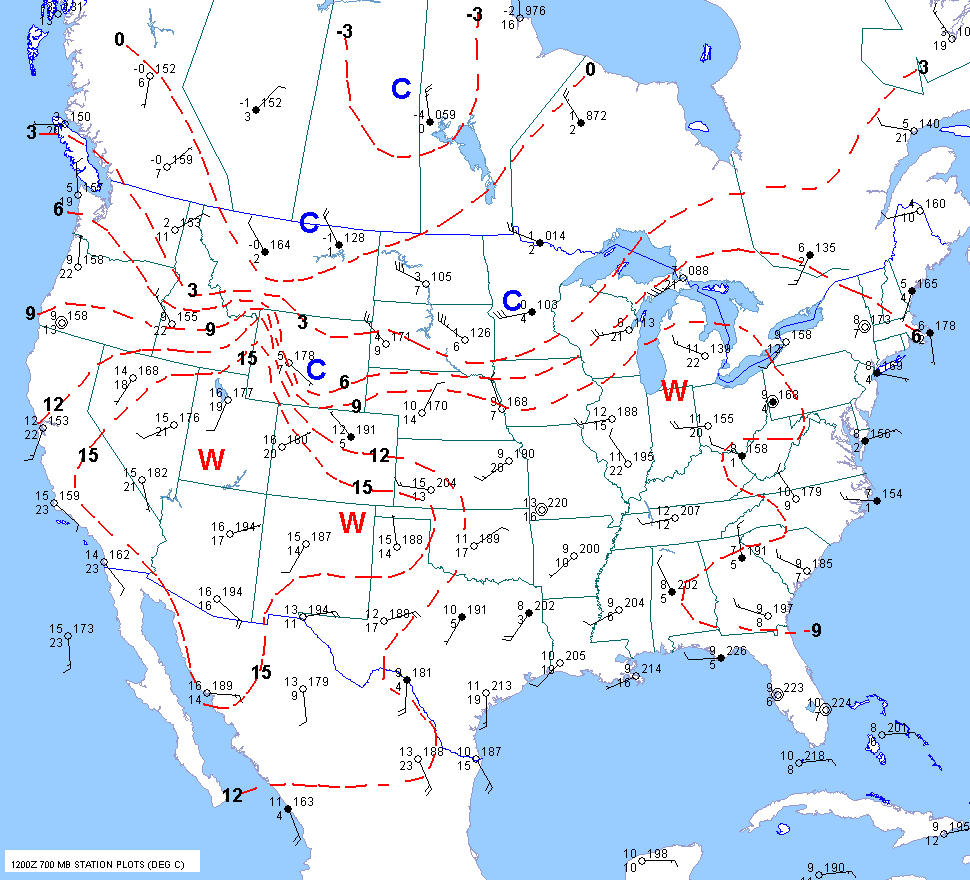
700mb temps on the 15th ranged from about 3 C around Sheridan to around
15-16ºC at Jackson Hole. With no upper air data between Boise and Lander, one may ask how I analyzed +15ºC
700mb temps across western Wyoming. Well, I was able to make judicious use of surface data to fill in
details where upper air data were lacking. This wedge of warm
air was analyzed based on the surface tempertatures at
Jackson Hole
and
Yellowstone. Afternoon surface temperatures at Jackson Hole and
West Yellowstone
were lifted up to 700mb to yield the 700mb temperatures above
these stations. Sometimes the low-levels become superadiabatic,
yielding a 700mb temperature that is too warm. So the best method is
to use the mixout temperature, whether
this
occurs at local noon (in windy conditions) or sometime in the early
afternoon in lighter wind conditions. In most
of my front
range tornado cases, surface winds under the mid level hot plume are
breezy to windy and afternoon dewpoint
depressions are fairly high. Surface winds on July 16, 1979 were not
as strong. Also notice the 700 mb baroclinic
zone across
the midwest and northern plains. There is upper level support
for a front across this area, but not
further south in
New Mexico. By the end of July 15 (
06 UTC July 16), the front over New Mexico is about to undergo
frontolysis. The
surface winds over eatsern Colorado were becoming more southeasterly, resulting in strong
moisture
transport onto the front range. The surface dewpoints at Denver and Akron were up to 59F and 60F respectively.
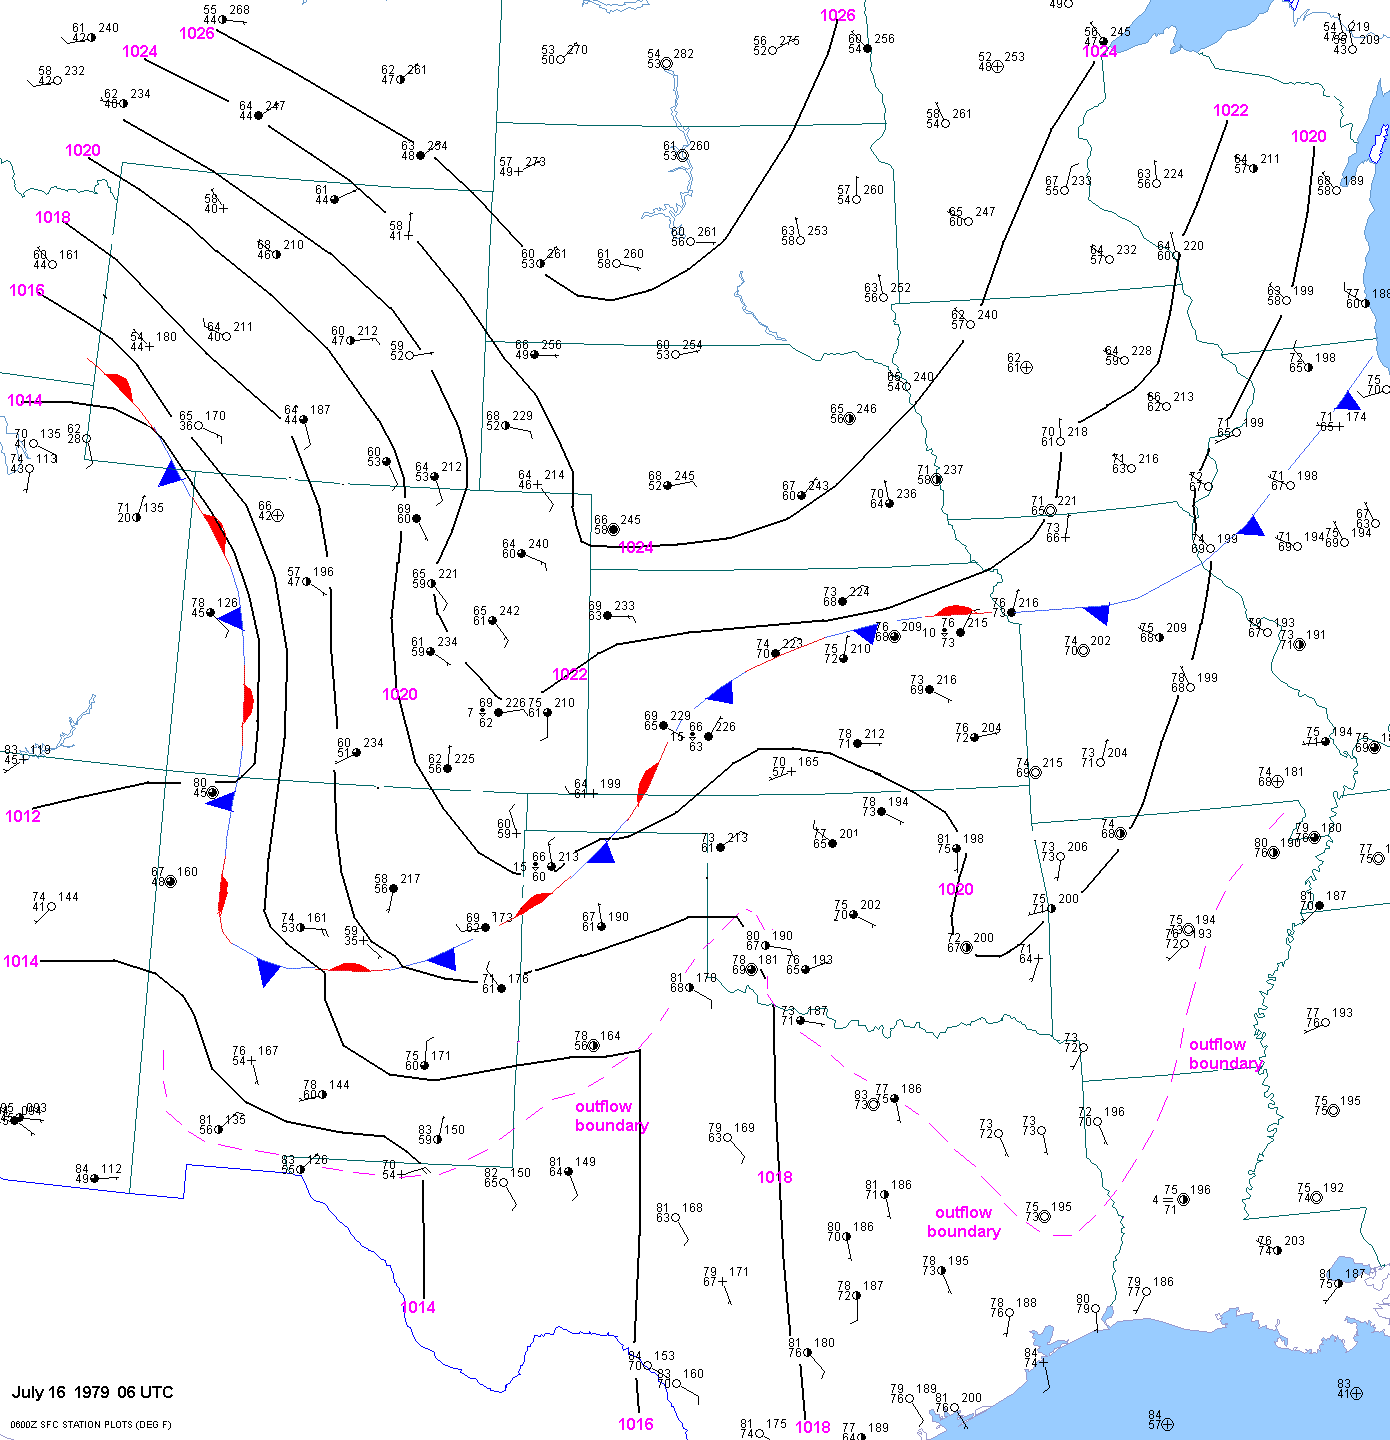
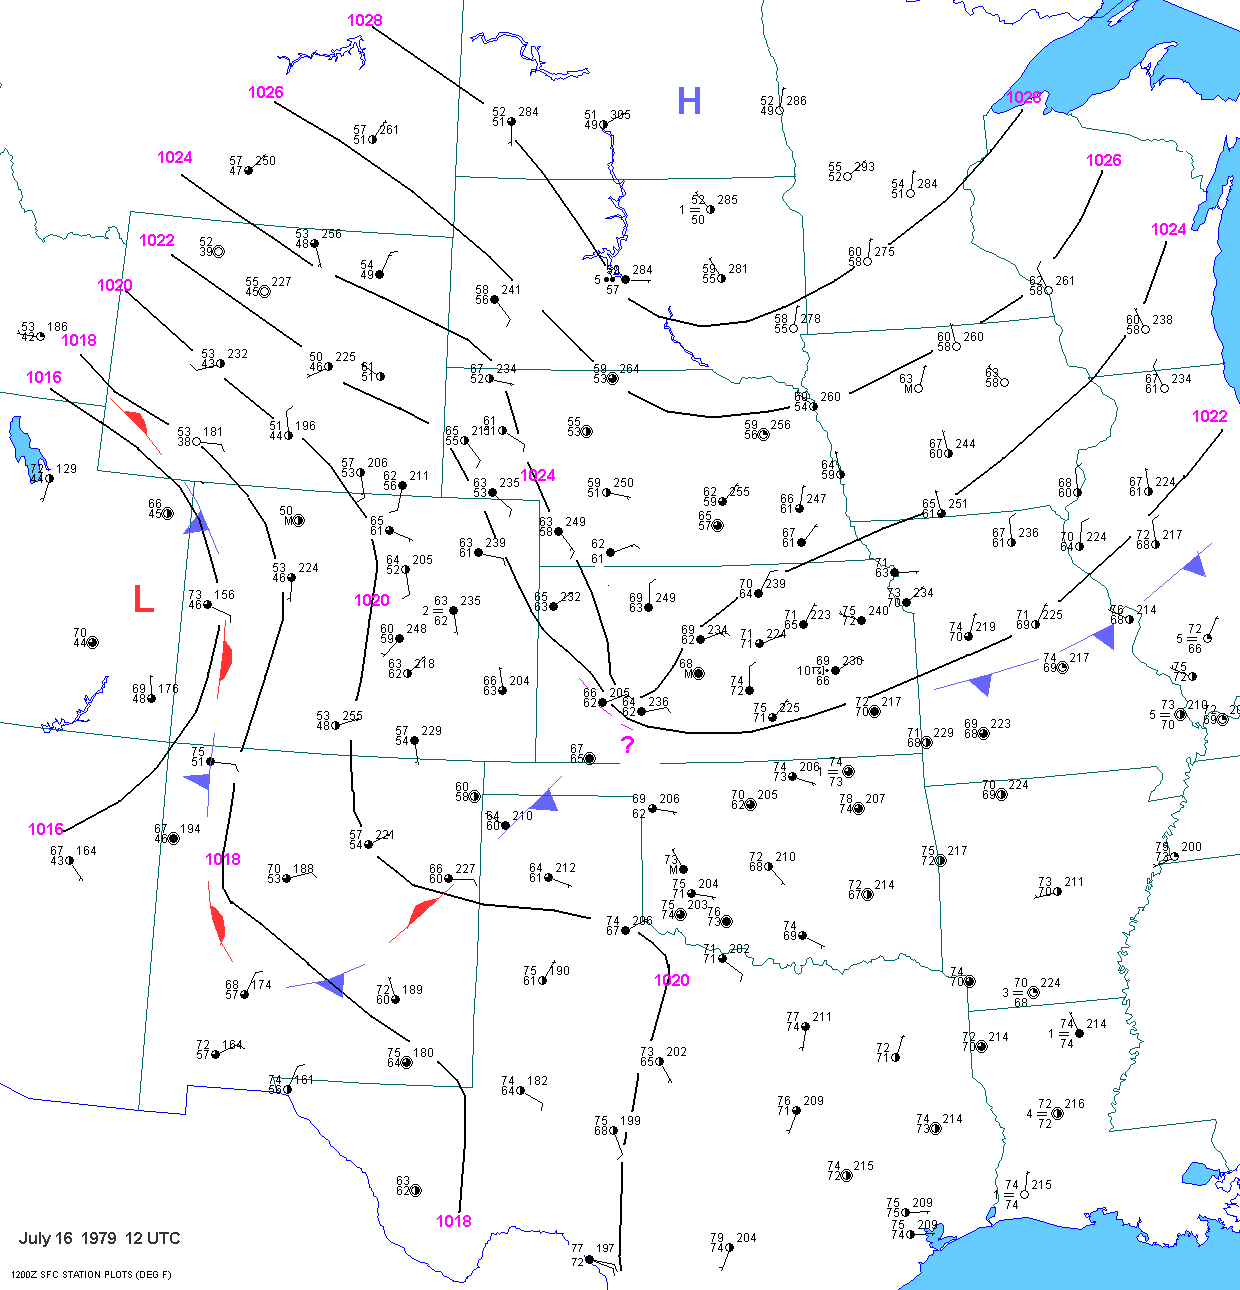
July 16
By 12 UTC July 16, the front over New Mexico was
undergoing frontolysis. A
700 mb baroclinic zone was located across Iowa. The
surface front
associated with this baroclinic zone was further south as one would
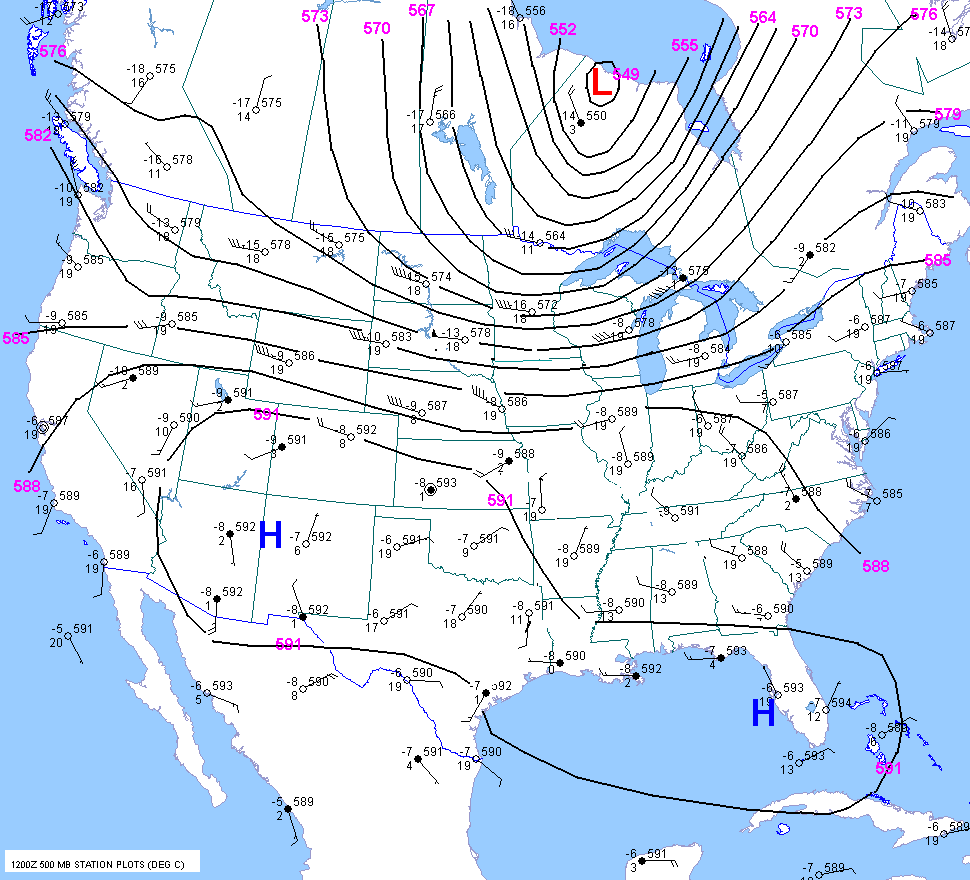
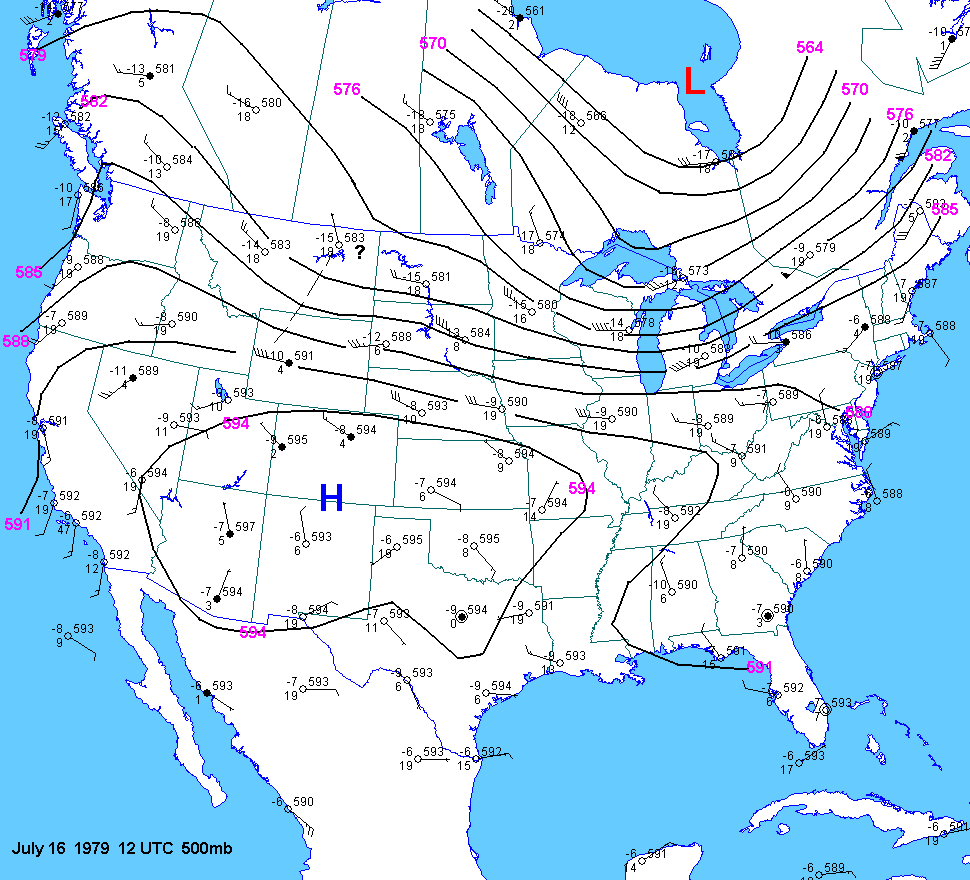
expect in Iowa Illinois and Missouri. A shortwave trough was
evident from the
500 mb chart over Montana and northwest Wyoming. The tail end of the upper
jet streak
was located over eastern Montana. The surface dewpoints at Sidney,
Akron, and Cheyenne were up to 60F, 61F and 56F respectively.
Note again that an adjustment of 7F was made to the Sidney dewpoint.
Strong surface pressure rises were
occurring at Dodge City and about to occur at Garden City at 12 UTC but
I am not
sure why. Accas was reported at Cheyenne on the morning of the
16th after
the low clouds burned off. Therefore, high lapse rates were likely
present
along the
eastern extremity of the warm plume(elevated since low levelcooling occurred at Cheyenne overnight).
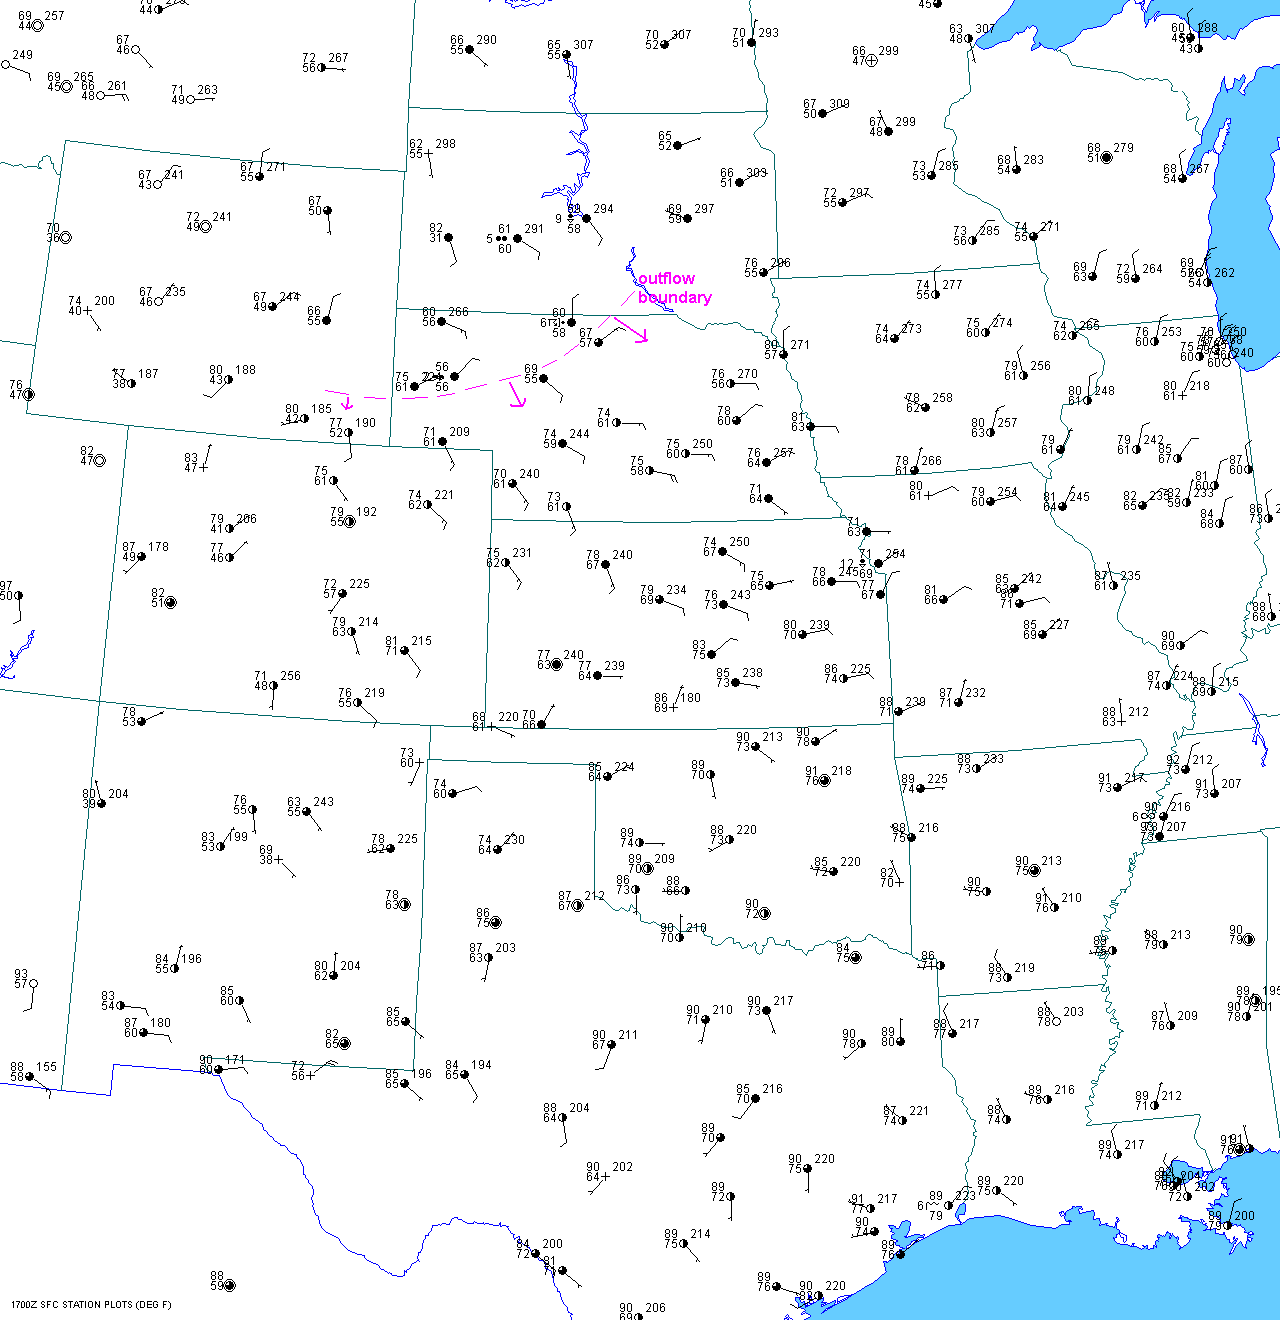
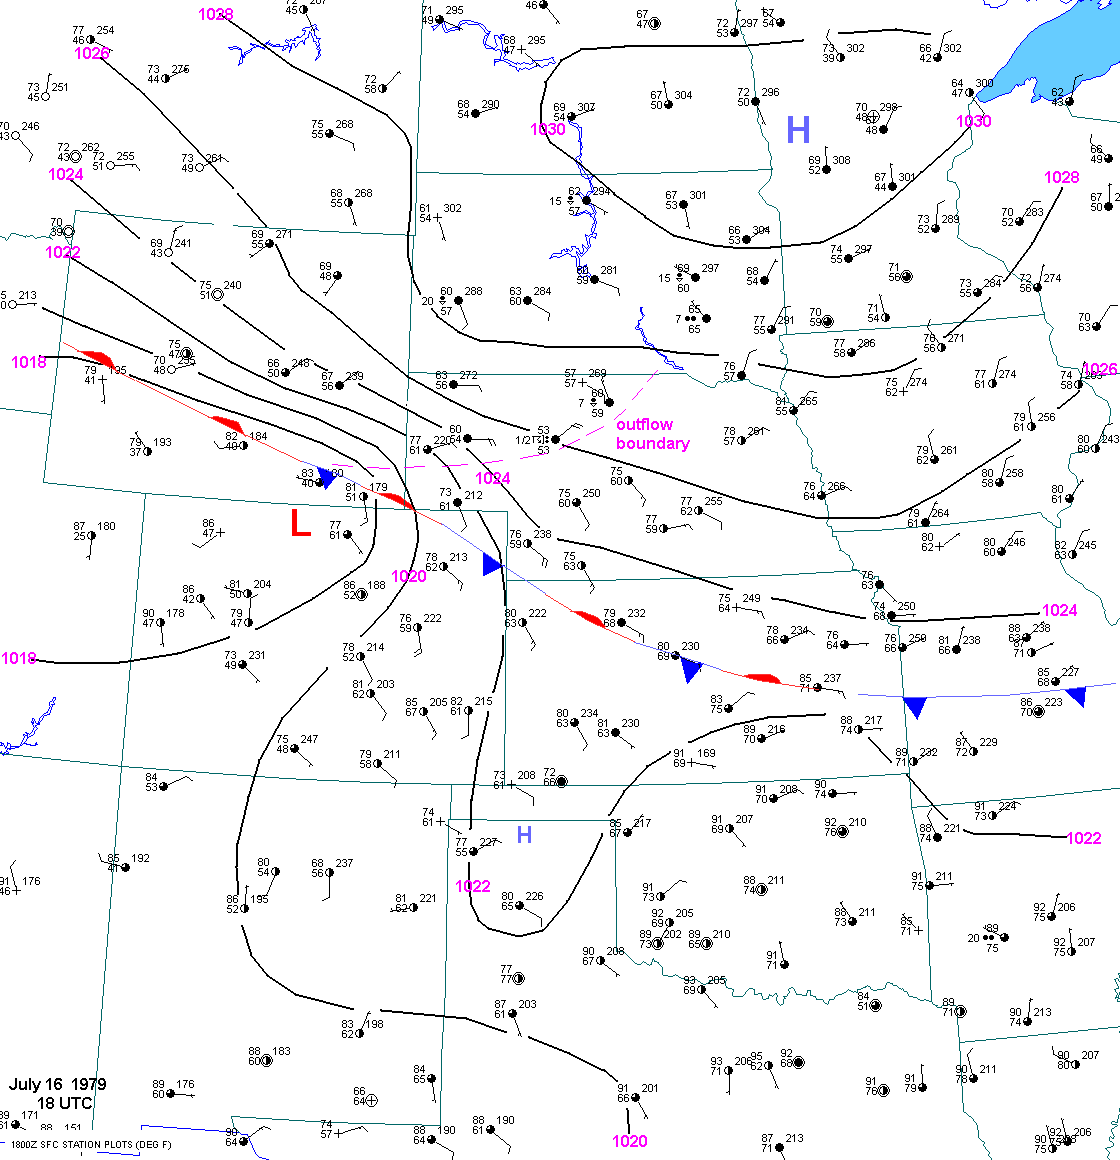
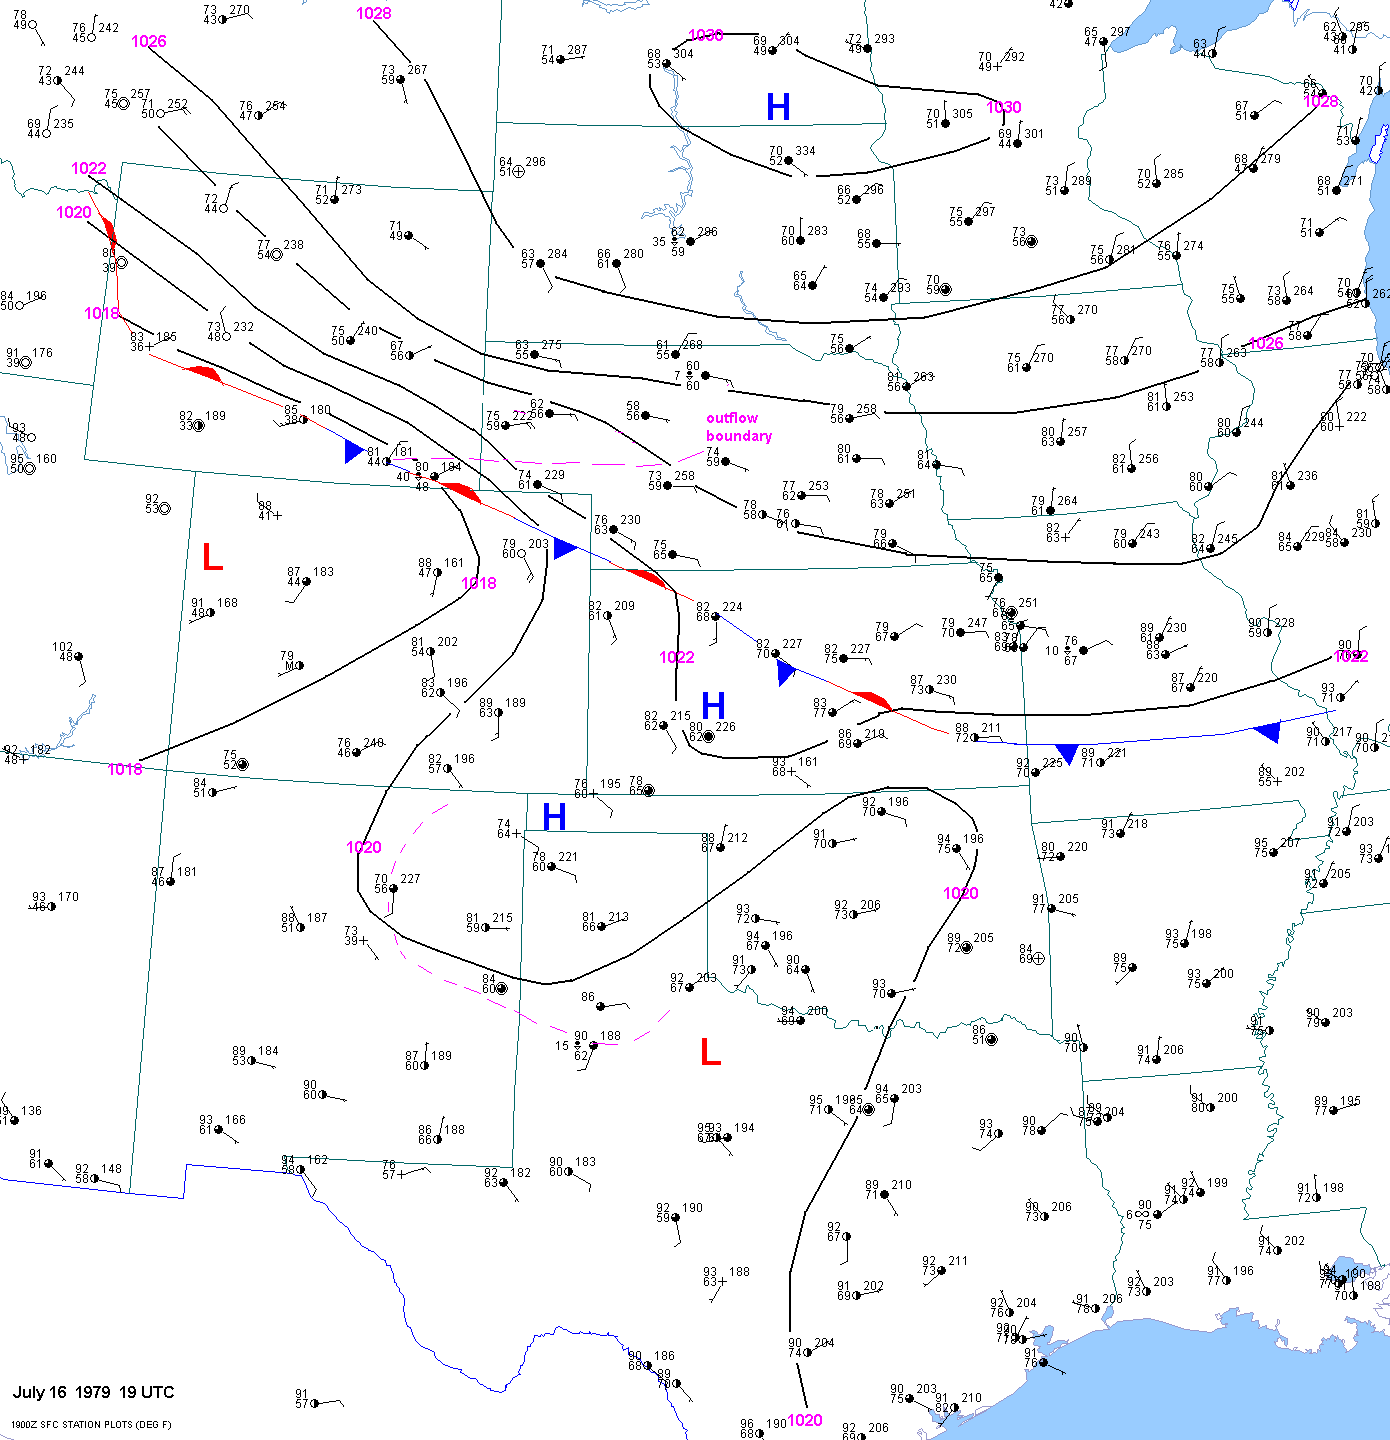
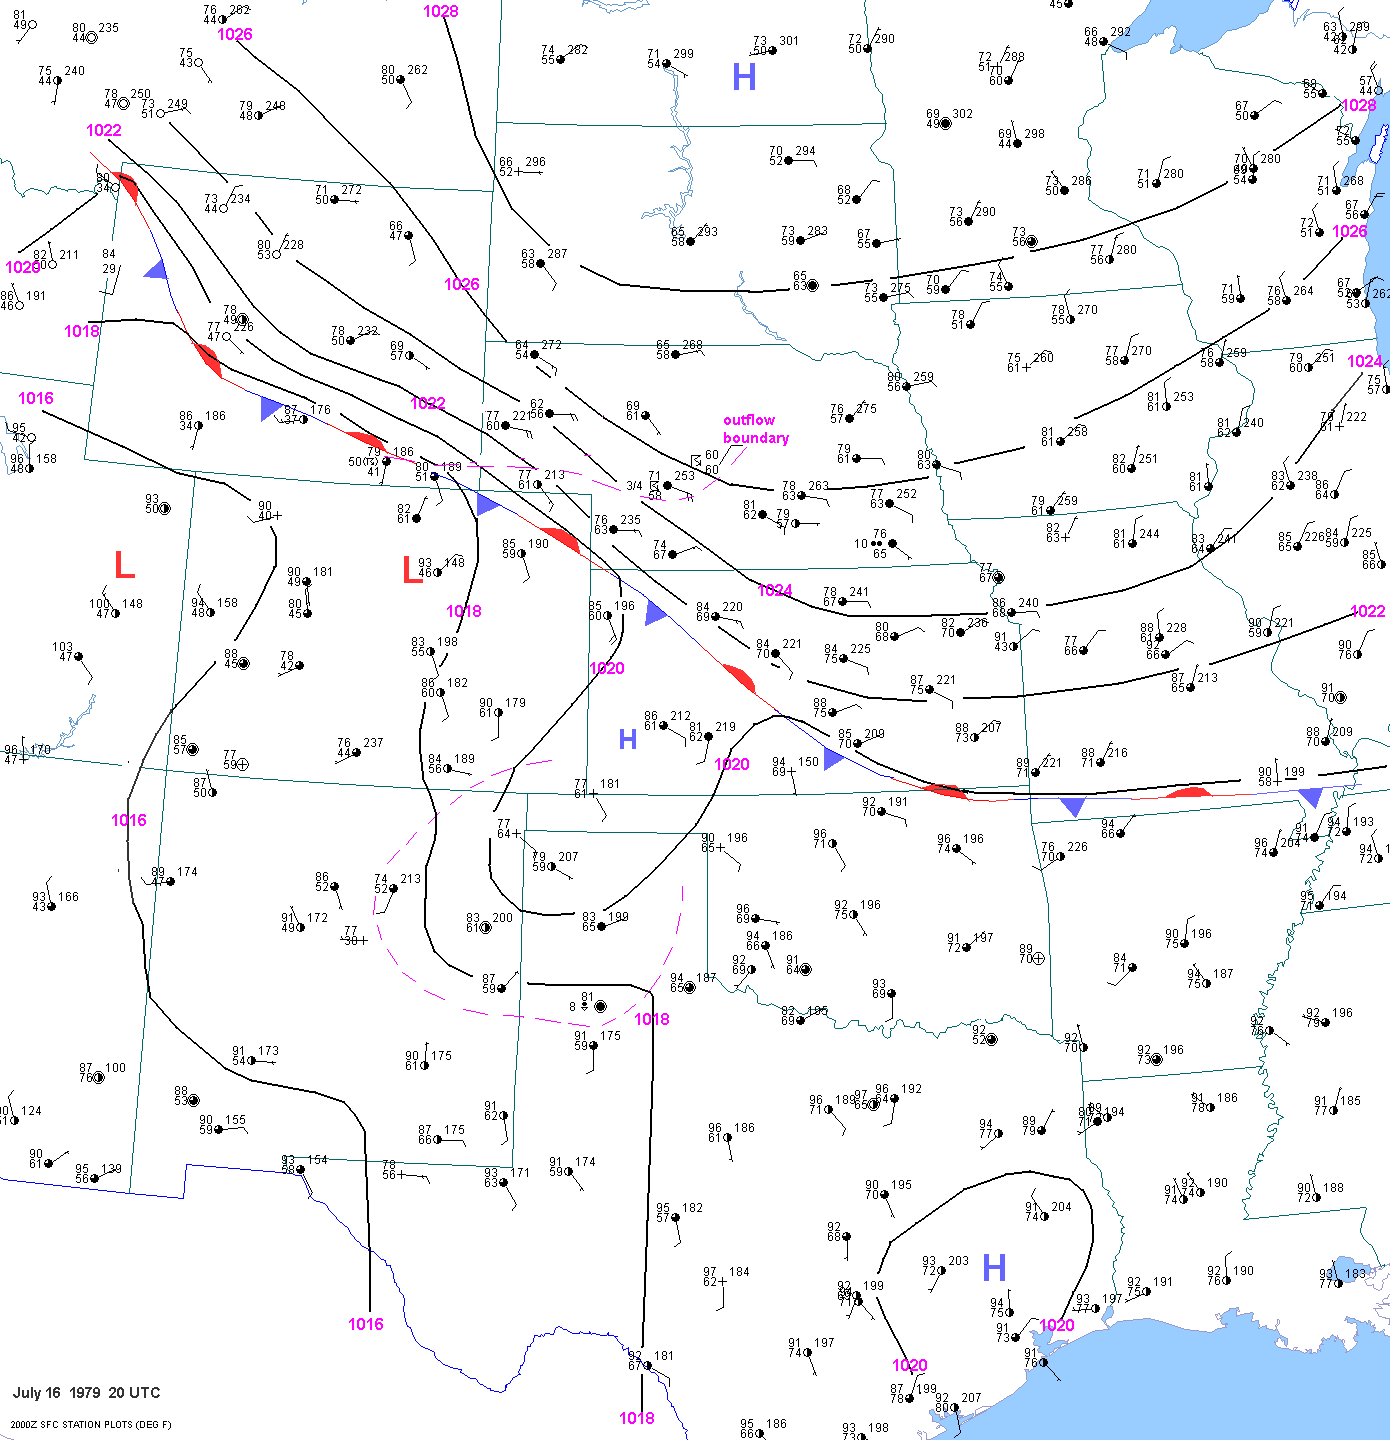
From 17 to 20 UTC July 16, an area of thunderstorms
moved east-southeast across Nebraska, leaving an outflow boundary trailing back to the west into southeast
Wyoming. Frontogenesis was also occurring across southern Wyoming and northeast Colorado. By 20 UTC, the
leading edge
of a strong pressure gradient marked the location of the new surface frontal boundary. This makes
sense based on
the position of the upper jet at 12 UTC. I was able to plot the location of the outflow boundary at
around 15 UTC using time series of surface observations from Scottsbluff, Alliance, Mullen and Ainsworth,
NE.
17 UTC 18 UTC 19 UTC 20 UTC. It is possible
that this boundary sagged into the Cheyenne area around
the time of the
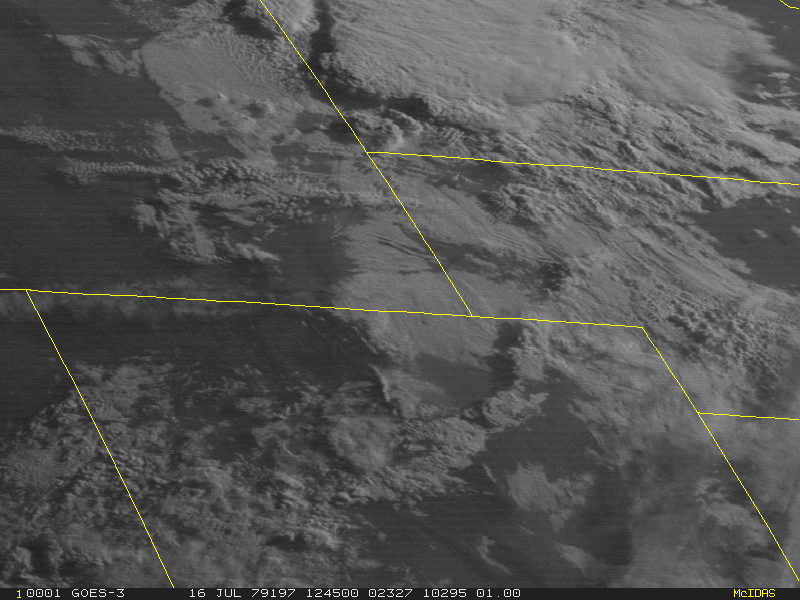
tornado. A satellite loop of this event is
here.
|
Time(UTC) |
VIS/WX/CLDH |
T/TD |
Wind |
ALT |
Scottsbluff
|
1553
|
|
1023.3
|
14010 |
029 |
|
1657 |
|
|
07010 wshft 1655 |
032 |
| Alliance |
1549 |
20 SM |
1020.6 |
14020 |
|
|
1650 |
2SM BR OVC007 |
|
04012 |
|
| Mullen |
1645 |
10SM OVC020 |
69/55 |
13010 |
034 |
|
1730 |
1/2SM +TSRA A OVC005 |
53/53 |
04020 |
040 |
| Ainsworth |
1643 |
|
67/57 |
05015 |
042 |
|
1715 |
-TSRA |
|
34015 |
045 |
|
1745 |
7 -TSRA |
60/59 |
34015 |
050 |
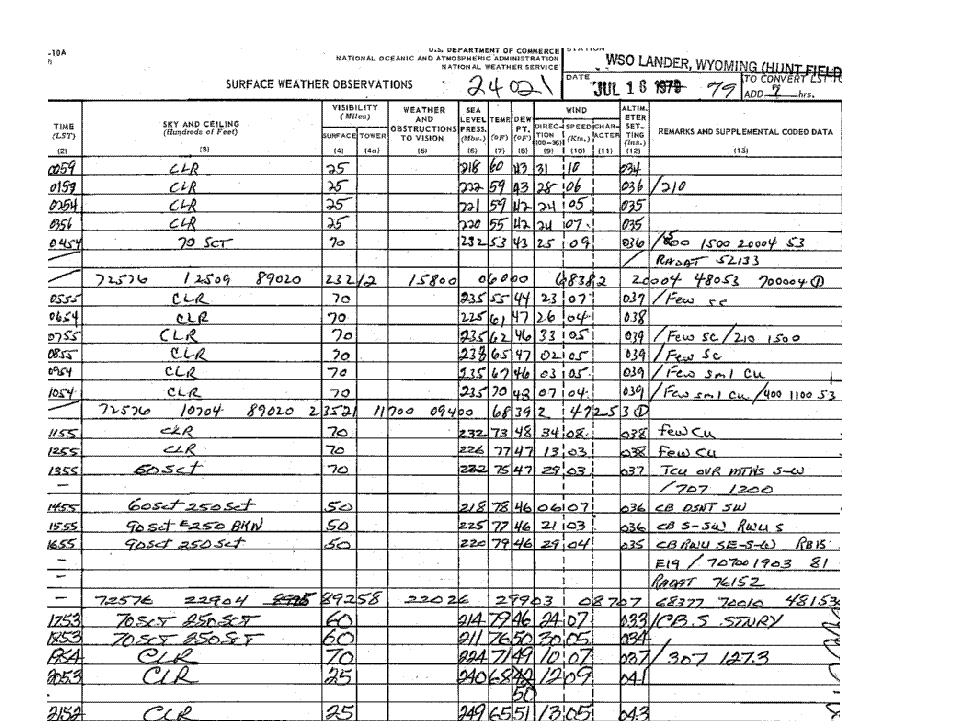
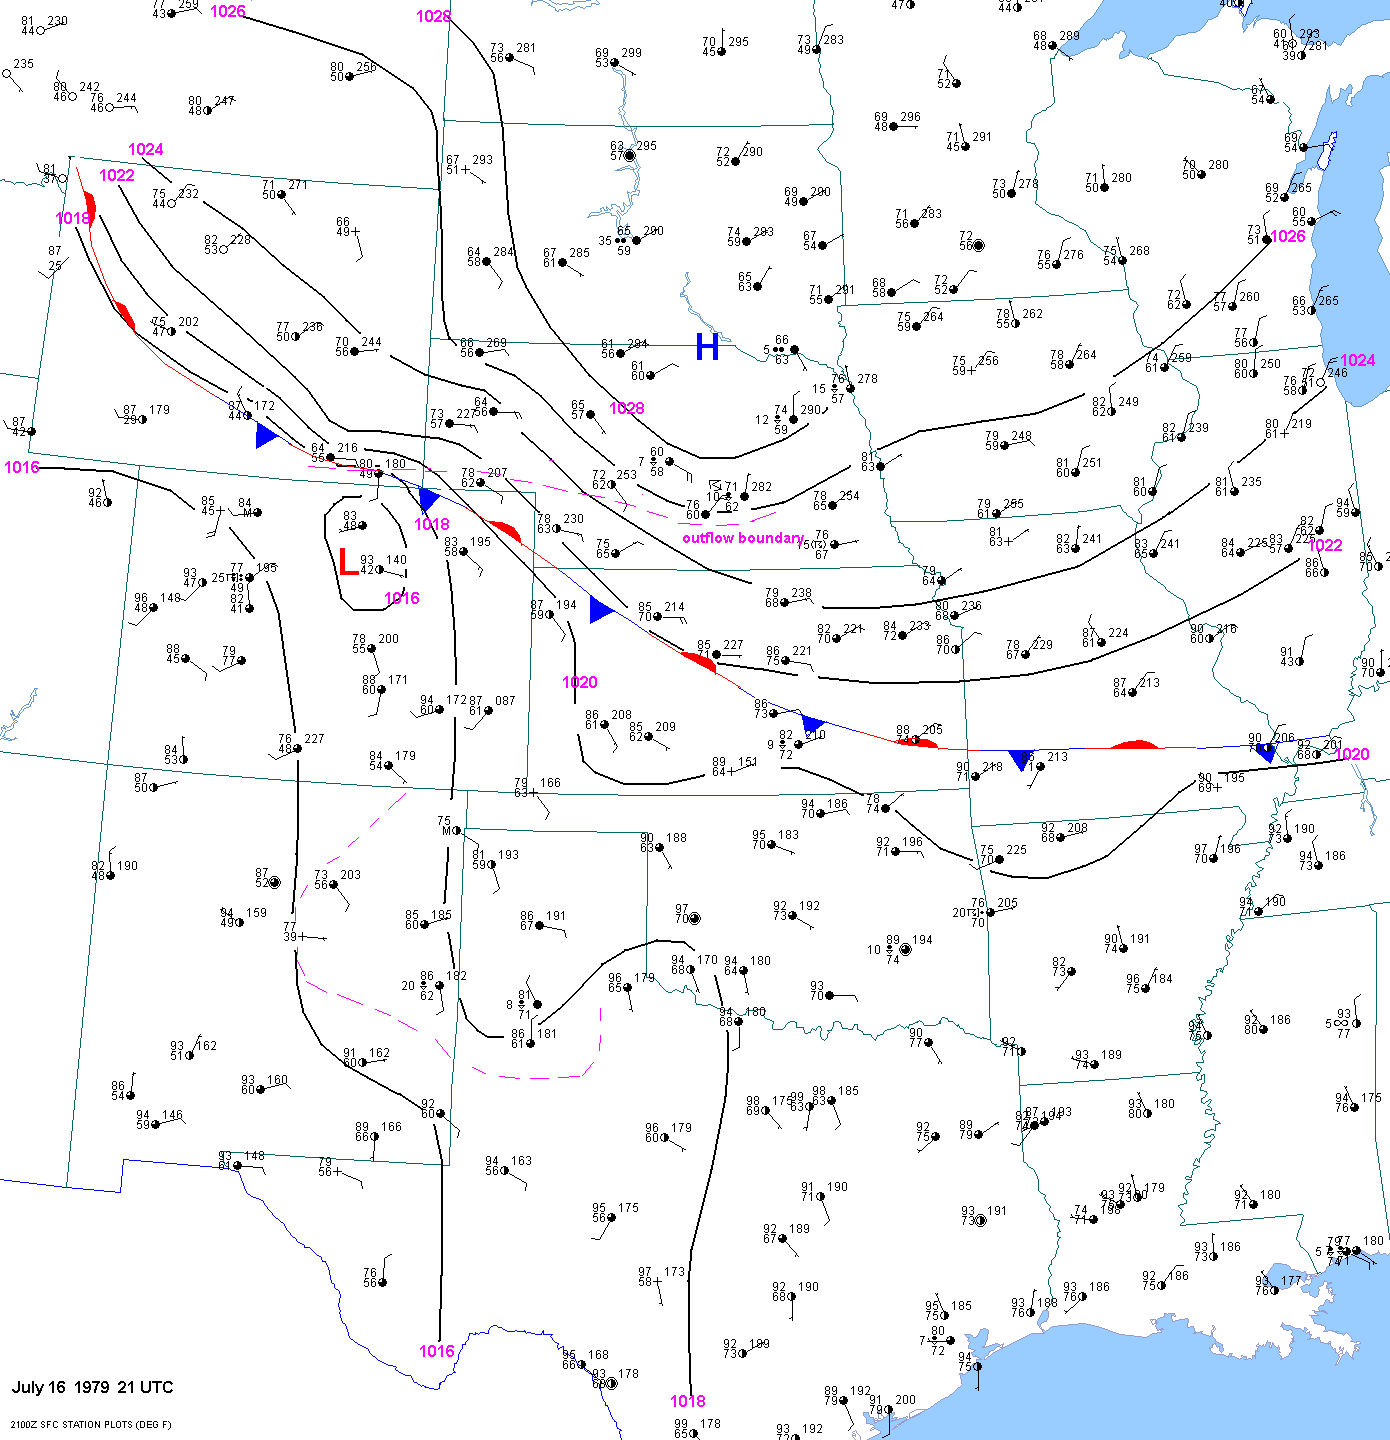
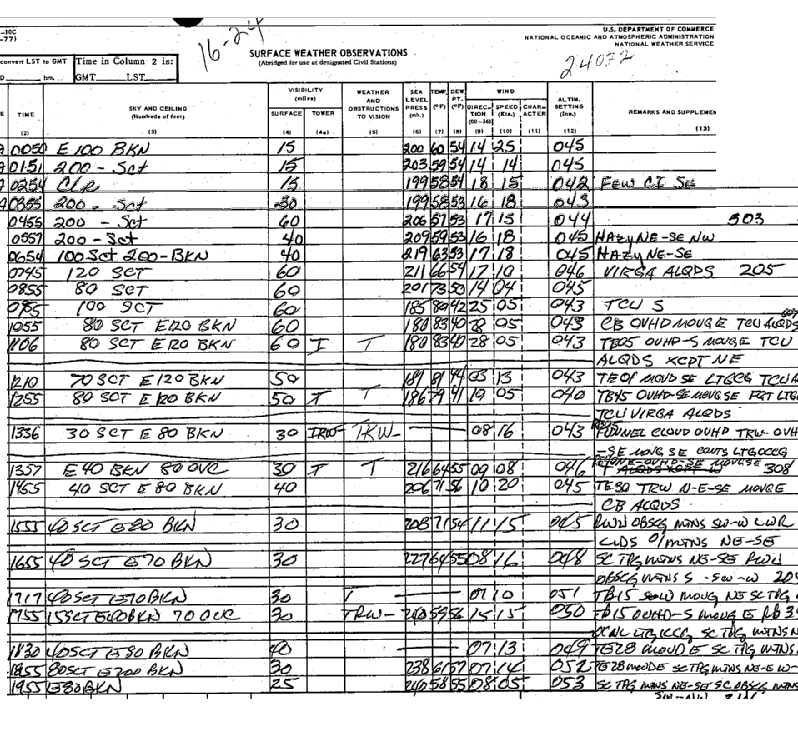
By the afternoon of July 16, a well defined
frontal boundary extended from east of Yellowstone to east
of Jackson Hole to west of Lander to near Rawlins, to
near Laramie to near Cheyenne. Note that
Lander was north of the front all day on July 16 since the winds were light and
the dewpoints were high (uper 40s F). The boundary was undoubtedly situated west of Lander where the woman was struck
and killed by lightning. The observations at
Rock Springs show the frontal boundary to the north of them in the
afternoon. Then the wind
shifted to the northeast at 00 UTC signifying a frontal passage.
Between
20 and
21 UTC,
the front (enhanced by thunderstorm outflow) sagged south through Laramie, possibly
as a result of late morning and early afternoon thunderstorm activity
near the front that was hovering close to
Laramie and
Cheyenne.
The dewpoint at Laramie jumped to 56F at 21 UTC but the
temperature was a cool 65F. Local thunderstorms in the vicinity of the
front near Laramie were probably the reason
for this cool temperature. The
frontal positions were estimated by looking at time series of surface
observations for surface stations across the plains. For example, at 19
UTC, it is
clear that the front is north of Rawlins, north and east
of Rock
Springs and east of Jackson Hole and West Yellowstone. It appears
that the
front is immediately north of Cheyenne and Laramie since thunder was
reported at both stations. The front was very difficult to find across
central
and eastern Kansas, but the pressure gradient north of the front became
more pronounced during the day. Southeast Wyoming was located
in the right rear
quadrant of a
jet streak on the afternoon of the 16th.
700mb temperature approximation
The mid level warm plume shifted east from July 15
to July 16, with 700 mb temps warming to +18 to 19ºC across parts of southwest and south central Wyoming
and adjacent northern Colorado. A strong sfc-700 mb baroclinic
frontal zone was apparent across Wyoming.
The 00 UTC 17th Denver sounding showed +14C at 700 mb. However, this
sounding was contaminated by
convection. Since Denver mixed out completely by 20 UTC with a
surface temperature of 93ºF, the 700 mb
temperature was surely 17C just before the cool outflow arrived.
The 700mb temperature at Grand Junction at 00 UTC July 17 was 17C. The maximum
temperature was 97ºF. If you lift a parcel dry adiabatically from the surface (856 mb) to 700 mb you get
18ºC. Therefore it is typically better to subtract 3ºF from the high
temperature before lifting to 700 mb when determining
700 mb temperatures, especially in light wind
situations. In strong wind and very dry situations at elevations above 6000 ft, the
local
noon temperature would give a closer
approximation. In this case I used the maximum temperature (ºF) or
maximum temerature (ºF -3) depending on the station) to augment the 700 mb chart. 700 mb temperatures in
the
hot plume on the morning (12 UTC) of the 15th and 16th were about 2 to 3ºC cooler than at 00 UTC. This is because
the diurnal cooled layer extends up
beyong 700 mb at stations above 5000 ft. This is obviously not the case at
high plains stations such as Amarillo
and Dodge City. At these locations, the hot plume sometimes actually
moves east away from the rockies between 00 and 12 UTC,
yielding very warm 12 UTC 700 mb temperatures.
The mid level warm plume shifted east from July 15
to July 16, with 700mb temps warming to +18-19C
across parts of southwest and south central Wyoming
and adjacent northern Colorado. A strong sfc-700mb
baroclinic frontal zone was apparent across Wyoming.
The 00 UTC 17th Denver sounding showed +14C
700mb. However, this sounding was contaminated by
convection. Since Denver mixed out completely by 20
UTC with a surface temperature of 93F, the 700mb
temperature was surely 17C just before the cool outflow
arrived. The 700mb temperature at Grand Junction at 00 UTC July 17 was 17C. The maximum temperature
was 97F. If you lift a parcel dry adiabatically from
the surface(856mb) to 700mb you get 18C. This is why
it is typically better to subtract 3F from the high
temperature before lifting to 700mb (when determining 700mb
temperatures). This is especially true in light wind
situations. In strong wind and very dry situations, the
maximum temperature would give a closer
approximation. I used the maximum temperatures at several stations
to augment the 700mb chart.
|
Elev(ft) |
Pres.(mb) |
MaxT(ºF) |
MaxT(ºF) -3 |
700 mb T |
Rock Springs
|
6760 |
800 |
88 |
85 |
18
|
| Rawlins |
6813 |
799 |
88 |
85 |
18 |
| Jackson Hole |
6560 |
805 |
87 |
84 |
16.5 |
| Yellowstone |
6640 |
803 |
83 |
80 |
15 |
| Eagle |
6540 |
809 |
91 |
88 |
18 |
| Rifle |
5540 |
835 |
93 |
90 |
17 |
| Denver |
5300 |
841 |
93 |
90 |
16.5 |
| Grand Junction |
4858 |
856 |
97 |
94 |
17 |
| Vernal |
5280 |
841 |
92 * |
93 |
16.5 |
The maximum temperature at Jackson
Hole was 87ºF.
Lifting 87ºF at 805 mb up to 700 mb yields a 700 mb temperature of
18.5ºC. However, you can see that Jackson Hole had
not "mixed out" by local noon since they were stuck in a fairly fairly
light wind regime. Therefore, I decided to
use MaxT (F) -3 = 84ºF as the mixed out temperature. This yields a
700 mb temperature of 16.5ºC. The same procedure was
used for Yellowstone. Vernal, UT as well as much of northern
Utah is lower in elevation. I used the maximum
temperature there to find the 700 mb temperature.
Theta-e Comparison
The first indication of a tornado was 3.5 miles
west-northwest of the Cheyenne
airport at 335 pm MDT (2135 UTC). The 22 UTC surface chart shows the front just
south
of Laramie.
The T/TD were 71ºF/56ºF. At this time the tornado was probably just finishing its rampage
across
northern
Cheyenne. By mid-summer standards in the central or eastern USA this would be a very
cool temperature and a low dewpoint such as would be found behind
a strong cold front. However, the
elevation of Laramie is 7270 ft. The author of this page believes
that the theta-e was similar near Cheyenne and Laramie on the immediate cool side of the
boundary. Despite the T/TD being 12ºF/16ºF lower at Laramie than
Topeka, the theta-e was actually slightly
higher at Laramie than at
Topeka.
| 01 UTC |
Elev(ft) |
Pres.(mb) |
SLP(mb) |
T(ºF) |
Td(ºF) |
MR(g/kg) |
theta(ºF) |
theta-e(K) |
Laramie
|
7270
|
788 |
1023.3
|
71 |
56 |
8.3 |
98.3
|
354.3 |
| Topeka |
881 |
991 |
1020.6 |
83 |
72 |
11.2 |
80.8 |
353.6 |
CAPE Approximation
Since the storm was near the boundary, surface based CAPE
estimations were made on both sides of the boundary. To estimate the CAPE on the cool side of the boundary I used the 22
UTC surface observation at Laramie. This was the only high elevation location in the most air immediately north
of the boundary at 22 UTC. The T/TD were 71ºF/56ºF with a surface pressure of 788 mb. I used this information
along with nearby soundings from North Platte, Lander and Rapid City, Dodge City and Denver to create an
approximate sounding for the "cool" side of the front. The surface
based CAPE was
around
2800 j/kg
at 22 UTC. A T/Td of 71ºF/56ºF
at Laramie would give the same theta-e as 77ºF/57ºF near
Cheyenne. At Cheyenne it was 81F in the early
afternoon. But immedialtely north of Cheyenne it was surely cooler,
with much higher dewpoints. In fact,
the dewpoint jumped to 56ºF at Cheyenne by 22 UTC, but the
temperature
was cooler due to nearby
thunderstorms. Just south of the outflow boundary or front,
surface based CAPE values were lower. The T/TD at the Cheyenne
airport at 20-21 UTC were 80ºF/50Fº and
81ºF/49ºF. Using the same thermal profile aloft(500-200
mb), the surface based CAPE at Cheyenne was 1500
j/kg. Keep in mind that the Cheyenne tornado moved just north of the
airport, possibly along the surface boundary. So the storm could have
been ingesting air from both sides of the boundary.
Cloud Bases
I do not have enough information to determine if the
storm was realizing the higher CAPE just north of the boundary, or if the storm was mainly ingesting air from the
warm side. If the former is the case then the storm would have been lower based and the vertical wind shear would have
been stronger given the easterly winds and higher dewpoints in the cooler
air. I cannot reliably compute the shear profile or storm relative
helicity. On the front range and mountain region, it is very difficult to approximate the 1 to 2 km
AGL wind profile. While the surface wind and winds at and above 500 mb (~4 km) might be known in this case, wind speed
and direction approximations from just above the surface to 3 km are not
very accurate.
Upper air charts:
7-15-79 00 UTC 700 500 250
7-15-79 12 UTC 700 500 250
7-16-79 00 UTC 850 700 500 400 300 250 200
7-16-79 12 UTC 850 700 500 400 300 250 200
7-17-79 00 UTC 850 700 500 400 300 250 200
Surface charts
21 UTC 14 06 UTC 15 09 UTC 15 12 UTC 15 15 UTC 15 18 UTC 15 21 UTC 15 00 UTC 16
03 UTC 16 06 UTC 16 09 UTC 16 12 UTC 16 16 UTC 16 17 UTC 16 18 UTC 16 19 UTC 16
20 UTC 16 21 UTC 16 22 UTC 16