Related items of interest
Historical Tornado Cases for the Cheyenne Warning Area
Detailed Tornado Cases for the Cheyenne Warning Area
Historical Tornado Cases for the Boulder Warning Area
Historical Tornado Cases for the United States
Elevated Mixed Layer
Elevated Heating
High plains and front range topo maps
Severe Weather Occurrences
On July 26, 1993, isolated thunderstorms developed around 1830 UTC near in Converse county. These storms
moved east into South Dakota by 21 UTC. The
first tornado of the day occurred 4 miles northwest of Sturgis at
1819 UTC. The time of this report is suspect since
visible satellite imagery showed no thunderstorms in this area
until after 20 UTC. The rear window of a
hatchback was sucked
out, the doors of a barn were ripped off and a
fuel tank was tossed 400ft. Golfball sized hail
occurred in
Niobrara county, WY and Custer county, SD at 2040
UTC and 2210 UTC respectively. A tornado was
reported 3 miles
southeast of Hot Springs, SD at 2145 UTC.
Severe storms also occurred in very rural areas of
northwest Kansas after 19 UTC. There were several reports of
large hail and one funnel cloud report. It is
possible that tornadoes occurred in rural areas between Tribune and
Colby.
At 1953 UTC(153 pm CST), a funnel cloud was reported
2 miles west of Winona. At 2010 UTC, golfball sized hail
was reported 2 miles north of Winona. At 2130 UTC,
"large hay bails were blown around" 7 miles north of Leoti.
At 2355 UTC, 11 utility poles were downed 4 miles
north of Wakeeney.
At 0115
UTC, golfball sized hail broke out windows 24 miles north-northeast of
Sterling, CO.
Only one storm hit a populated area on July 26,
1993. Visible satellite imagery showed an area of cumulus developing
near the intersection of Albany, Platte and Laramie
counties(elevation 7000ft) at 18 UTC. This area of festering cumulus
slowly shifted eastward off the high terrain and was
centered over south-central Platte county at 19 UTC. An initial cell
developed by 20 UTC, but another cell exploded by 2018 UTC just east of Chugwater in southeast Platte county. At
220 pm MST(2120 UTC), a funnel cloud 3 miles
southeast of
Hawk Springs was relayed by the Torrington PD to the
National Weather
Service in Cheyenne. This report was likely a delayed report and
probably occurred earlier than
220 pm. The report was based on
information from a volunteer fireman who said that the
tornado never touched down.
But the report was
contradictory. According to the fireman, the cloud never reached the
ground, but drew up dirt in a
funnel shape and they never
connected. But the debris cloud does not have to meet
the condensation funnel to have a
tornado. So this was in all liklihood a
tornado but was never
documented as one. This apparent tornado may have
occurred before the report time. This storm
continued moving
east-northeast and
produced baseball to softball sized hail
in northwest Scottsbluff
county. A tornado touched down west of Scottsbluff and
hit the northwest edge of town around
3 pm. This tornado caused extensive damage
as it moved
from highway 26 to highway 71.
Several homes and businesses
were totally destroyed. A woman
sought refuge in a ditch and the tornado moved her 60 feet into a
field. This tornado
injured 10 people and was officially rated
F2. Here are
some photos of the tornado taken by Lynn Herdt of Scottsbluff.
Some of these show debris, with trees being
lofted.
Pic1 Pic2 Pic3 Pic4 Pic5 Pic6 Pic7 Pic8 Pic9 Pic10 Pic11 Pic12 Pic13
A map of severe weather reports for July 26 can be
found here.
The visible satellite loop for this event is very impressive.
Meteorological Discussion
What a month!!!
July was very active month for severe weather across
the plains and front rage. Severe weather with golfball or larger
hail or tornadoes occurred on all but the 25th and
29th. The highest concentration of severe weather occurred along
and north of a quasi-stationary front where
upslope flow carried
very high dewpoints from the flooded areas of Kansas
into Colorado. Then these storms would often
rumble east and south
and drench central and eastern Kansas as well as
eastern Nebraska.
July 24
July24 was quite an active day in the central
plains. Several damaging tornadoes occurred, along with large
hail.
Severe storms developed in northern Kansas in the
afternoon and then progressed into southeast Nebraska in the evening.
A strong shortwave trough progressed across the
northern plains on July 24. Despite the very warm 700mb temperatures,
storms developed across northern Kansas and became
tornadic in southern Nebraska. In fact, the entire troposphere
was warm on the evening soundings from Topeka, Omaha
and Dodge City, with 500mb/400mb/300mb temperatures
from -4 to -6C, -15 to -17C and -31 to -33C
respectively. The Topeka sounding had extremely high dewpoints of
25.6C, 24.3. 23.6, 21.8. 21.4,18.4, 16.3 and 15.3C
at 974, 925, 900, 859, 850, 839, 833 and 824mb respectively.
Until I worked on this case, the Topeka sounding from August 7 1962 00 UTC was the most moist sounding I had ever
seen. In the 1962 sounding, the surface dewpoint was
higher (27C) but the dewpoints between the surface and 850mb
were a little lower. However, the 1962 Topeka
sounding was more unstable (for surface based convection) owing to
cooler 500-300mb temperatures and a higher
surface dewpoint. The 21 UTC surface chart showed a thermal low over
central KS, and possibly an outflow boundary or warm
front near the Nebraska/Kansas line. The main synoptically
forced surface low was in the northern plains.
Storms developed just northeast of the thermal low.
July 25
A cold front pushed south into west Texas and
northwest Oklahoma behind the shortwave trough from the previous
day. By 12 UTC July 25, this front was located from northeast Kansas to near Clovis. At 21 UTC July 25, this front
was returning north on the western end,
stationary
over northwest Oklahoma, and still moving southeast as a cold
front
through Missouri. Rich surface moisture was noted
from northeast Kansas into the Texas panhandle. Low level drying
was beginning across central Texas. The 500mb chart at 00 UTC July 26 (5 pm MST) showed the northern plains
shortwave trough still progressing into
Minnesota/Wisconsin.
The 700mb chart featured a warm plume across the
southern Rockies. Very cool 700mb
temperatures were noted over the
northern Rockies, with a strong baroclinic zone
from northern California into Wyoming. The
next shortwave trough
was evident over the pacific northwest. By 06 UTC
July 26 (11 pm MST), the front was still
changing orientation with
the eastern end moving south and the western end
moving north as a warm front. Low level
upslope flow and moisture
advection was beginning across southwest Kansas.
Storms moved across Wyoming in the afternoon and
evening, leaving an outflow boundary from northwest Colorado
to near Cheyenne and then north-northwest to east of
Gilette.
July 26
Morning Hours
At 12 UTC July 26 (5 am MST), the front was becoming
harder to find on the western end. Also, radiational cooling on
the front range and Rockies made frontal analysis
even more difficult. Its is clear that moisture advection had occurred
overnight in western Kansas. A mesoscale convective
system was moving east across southwest Nebraska. The leading
edge of the outflow associated with this system had
long passed Akron, was just passing through McCook and was
approaching Goodland. The 12 UTC 500mb chart featured a strong shortwave trough centered over central Idaho.
Strong southwest flow(by mid-summer standards) was
located from northern Utah into central Wyoming. As one would
expect, a 700mb warm plume (+15C) was present across the central and southern Rockies. A strong 700mb baroclinic
zone had progressed east into Salt Lake City and
Lander. Rich moisture was present at Dodge City and Topeka
with
850mb dewpoints from 16 to 18C. One jet streak
was exiting the plains at 12 UTC, but another was obvious over
northern Nevada and northern Utah. The 400mb chart showed 50+ kts of flow entering the Nebraska panhandle.
By 15 UTC, the outflow boundary generated by the morning MCS stretched from east of Cheyenne to between Limon
and Akron to south of Goodland to south of Hill
City. On the western end of this boundary, but on the cool side, low
level upslope flow was transporting higher dewpoints
into northeast Colorado and eastern Wyoming. The dewpoint at
Wheatland, WY and Akron, CO were up to 59F and
62F respectively. Rich moisture was also located south of the
boundary
in western Kansas but not in eastern Colorado. The dewpoint at Sidney
was probably too low by 3-4F. This
may have been a
chronic problem since the mid 1970s as my other case studies
would seem to indicate. On the surface
maps I placed a red X beside the bad dewpoint at
Sidney.
By 18 UTC (11am MST), there was a strong surge of moisture upslope onto the central high plains. A dryline was taking
shape from eastern New Mexico into far eastern
Colorado. Now
that vertical mixing had broken the morning inversion
over the Rockies, a surface front cold front
could be
analyzed from
east of Rawlins into central Utah. The dewpoint at
Akron was up to 64F. The mesonet
observation at
Wheatland, WY
indicated a
62F dewpoint. So rich moisture was
already banked up against the mountains to
the north of
Cheyenne
by 18 UTC. The rich moisture seems to be just east
of Cheyenne. Also notice the strong
moisture gradient
between
Limon, CO and
Stratton, CO.
Convective Initiation in Wyoming
At 19 UTC, convective initiation was immiment to the east of the Laramie Range, and also in northwest Kansas. Let
us
first examine the severe storm environment in southeast
Wyoming.
The Scottsbluff tornadic storm developed out ahead
of a strong pacific cold front. By 19 UTC, the Laramie range
marked the western edge of the moist air that
was surging
upslope into southeast Wyoming. To the west and probably
on top of the Laramie range, dry and potentially hot
air was
noted. More moist, upslope flow was noted to the east. A
surface warm front separated these two
airmasses. This warm front moved
through Laramie by 17 UTC and was
probably located near the Laramie
Range by 19 UTC. An outflow boundary from overnight and morning
thunderstorms
over Nebraska was located across southeast
Wyoming. The surface boundaries,
moisture distribution and terrain features
are shown here.
The cold front moved through Rawlins just after 17 UTC, Laramie just after 20 UTC and Cheyenne around 22 UTC.
This front was generally progressing to
the
southeast at 25 to 30 mph. The progression of the front is known here
with fairly high confidence since I was able to
use time
series of surface observations from Rawlins, Laramie and Cheyenne.
The location of the area of developing cumulus
clouds at 18 and 19 UTC is shown. Then the approximate location of the
Scottsbluff storm is plotted at 20 and 21 UTC. The
location of the Scottsbluff tornado is shown around 22 UTC near
Scottsbluff. It is obvious that the tornadic storm
developed ahead of the cold front and stayed ahead of the cold front.
This process would have been more accurate in the
1950s and 1960s when comments often indicated the time of frontal
passage. The quality of surface observations
deteriorated greatly during from the mid 1970s to the early 1980s.
Many
surface observation stations stopped reporting
at night or even after 21 UTC. Of course, there has been a prevailing
wisdom that the only purpose of surface observations
is to serve the aviation community.
The storm developed
near the interface of the warm, dry air over and west of the Laramie
Range and the warm and
moist
air to the east. The moist air to the east was enhanced by an
overnight and morning MCS over northeast Colorado
and Nebraska.
On the same chart as the frontal progression, the 700mb temperature field at 19 UTC is presented. How did I develop
this chart? Well, from analysis of many high
plains severe weather events, I have found that 700mb and even 500mb
temperatures can often be estimated using surface
observations at 19 UTC (local noon) or after mixout occurs. The
time of mixout depends on windspeed and cloud cover.
But under dry and breezy conditions, this often occurs by 19
UTC at elevations above 6000ft. I took the 19 UTC
surface temperatures at Eagle, Laramie, Colorado Springs, Limon
and a few other locations up the dry adiabat to
700mb. To supplement these data, I used the 12 UTC and 00 UTC
700mb temperatures at a few surrounding stations. For
the immediate purpose of estimating 700mb temperatures near
the initiation point, the later was not essential.
This technique allows for a more detailed 700mb temperature analysis.
This is especially true if a cold front does not
progress through the stations between 19 UTC and 00 UTC. In this case,
surface dewpoint depressions were not high enough to
allow for 500mb temperature estimation. An example of 500mb
temperature estimation from surface date was on June 3, 1958.
The 700mb temperature was around +15C near the storm
initiation point. I estimated the 700mb temperature to be
+15.5 C at Laramie, +16C at Eagle, +17C at Limon and
+19C at Colorado Springs. The 00 UTC 700mb temperature
at North Platte was +15C. 700mb temperatures were similar along a line from Laramie to North Platte.
So convective initiation occurred early in the
afternoon despite the warm 700mb temperatures. However, keep in mind
that elevated heating often helps with cap
removal on the
high plains even when 700mb temperatures are as high as
16-18C. Magic numbers or rules of thumb
are often of
little use.
Convective Initiation in Kansas
Storms initiated south of Goodland around 19 UTC near the intersection of the outflow boundary and the dryline.
Very rich moisture continued to flow upslope into
northwest Kansas. Even though 700mb temperatures were very
warm(15C) in northwest Kansas,
elevated
heating north of the boundary, along with 70-72F dewpoints by 20 UTC ,
resulted in rapid convective development. .
"Cool" and Moist Upslope
Even though surfae temperatures were fairly "cool" in the upslope region from northwest Kansas into southeast WY,
potential temperatures were fairly high. So this airmass
was potentially hot and moist. For example,
the surface
temperatures/potential temperatures at
Wheatland, Akron and Goodland at 20 UTC were 79F/103F,
81F/106F,
and 86F/107F respectively. So potential temperatures
ranged from
103F to 107F on the "cool" side of the outflow
boundary.
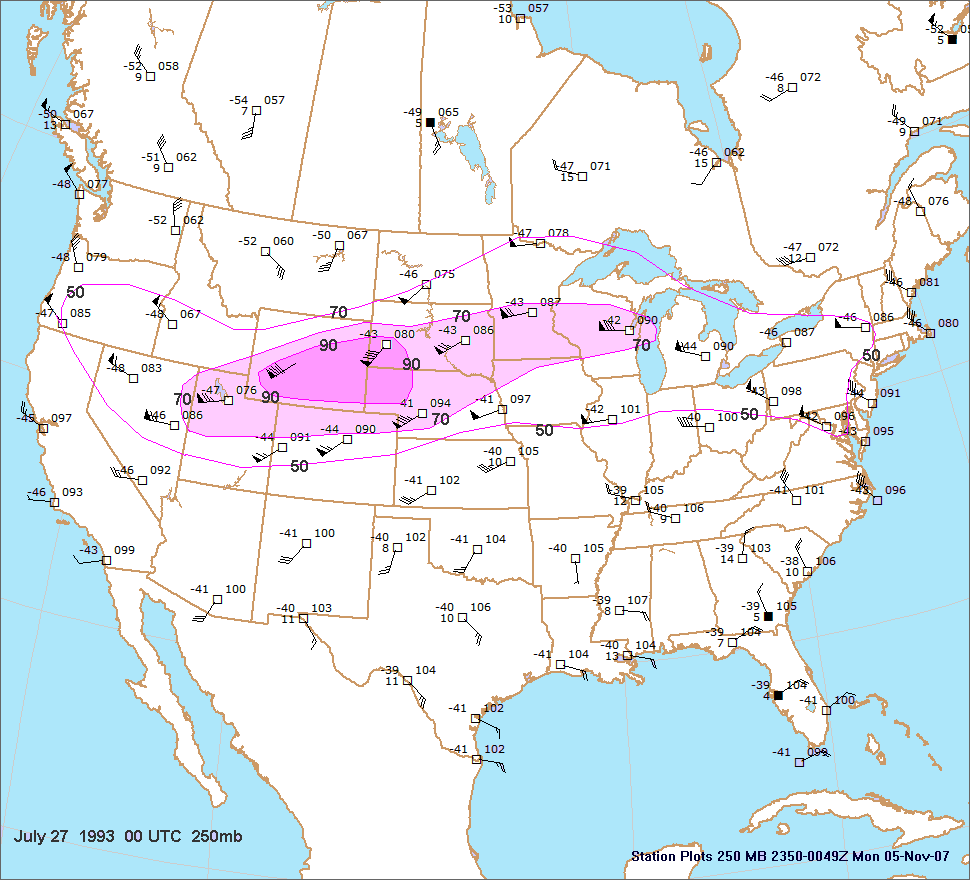
Shear,
Hodograph and Surface Based CAPE
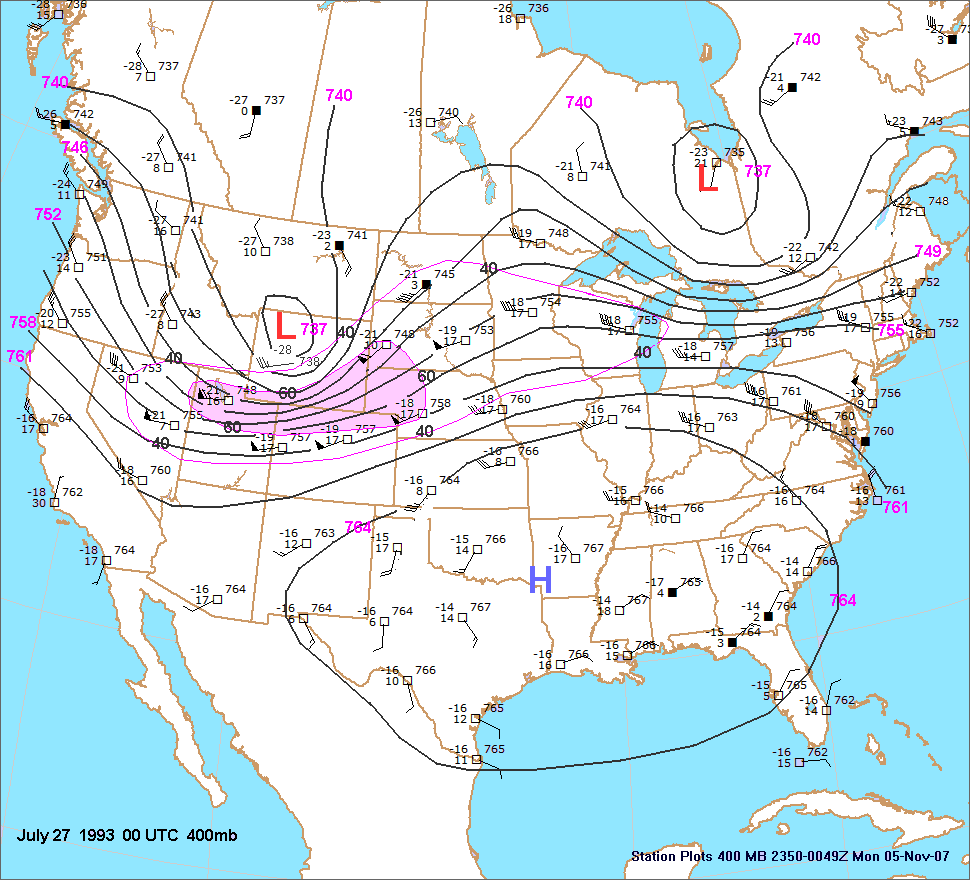
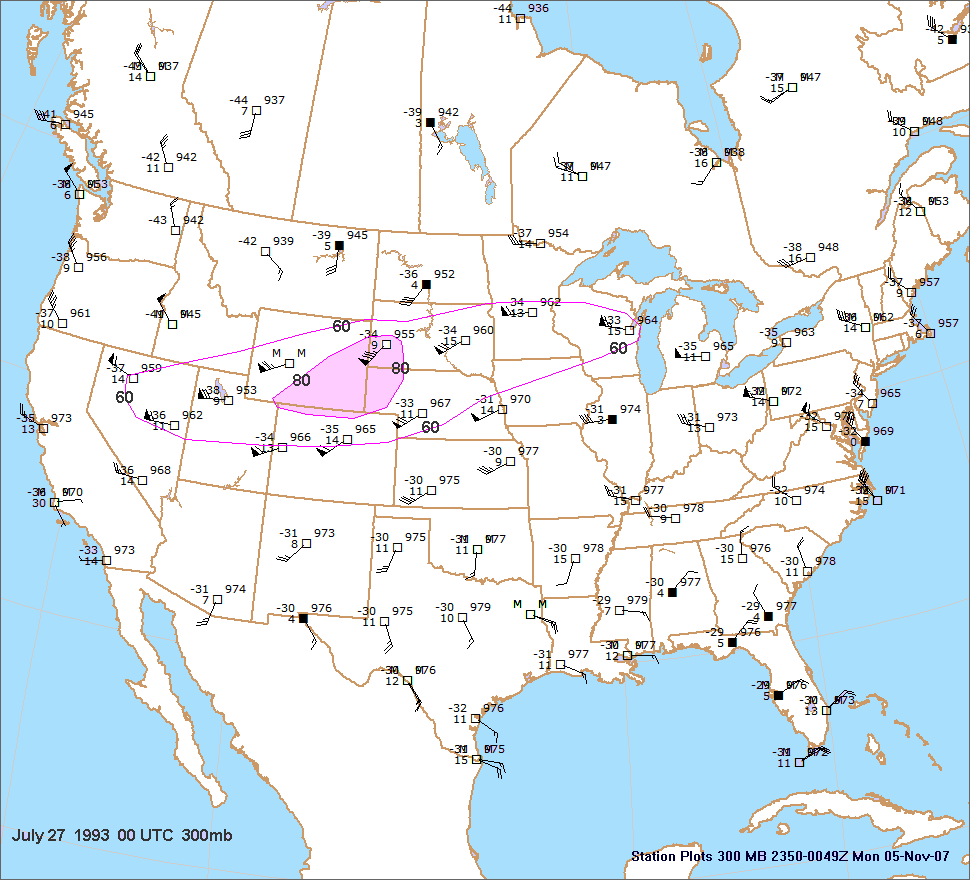
To assess the shear profile, let's look at the 00
UTC upper air charts. Since the Scottsbluff tornado occurred at 22
UTC, the wind profile was probably very similar to
the 00 UTC raob winds. Since the 400-250mb winds were
gradually increasing during the day, the wind speeds
in this layer at 22 UTC may have been slighly lower than the 00
UTC values. The
following table contains wind speeds and temperatures at various levels
based on the 12
UTC and
00 UTC UA charts. These values were used to
compute the wind and thermal profiles. To obtain the upper air
charts just click on the links in the table.
| Level |
850
|
700
|
600
|
500
|
400
|
300
|
250
|
200 |
12 UTC
|
XXX |
XXX 11 |
XXX 4 |
23045 -8
|
24050 -19 |
22560 -35 |
22570 -46 |
23590 -54
|
| 00 UTC |
XXX |
XXX 15 |
XXX 5
|
23045 -8 |
24065 -20 |
23580 -34 |
22585 -43 |
23585 -53
|
The 00 UTC 700mb chart shows light winds at Denver.
However, this may be a local feature associated with the
Denver cyclone. The surface observations from
Laramie from 18 to 20 UTC (just upstream from the tornadic storm)
showed 20kt southwesterly surface winds gusting as
high as 29kts. In the absence of any other clues, we will use
22525kt as our 700 wind vector and 22530kt as our
600mb wind wind vector.
Therefore our wind profile probably looked something
like this:
870
11020 SFC (agl)
850 12030
700
22525 1.8 km
600 22530 3.0 km
500 23545 4.6 km
400 24060 6.3 km
300 23075 8.3 km
250 22580 9.5 km
200 23585 11.0 km
Assuming the storm motion vector was 25025kt, the
storm relative flow was impressive at all levels. The approximate
hodograph shows a 0-3km srh of 363. Keep in mind that this is a very rough approximation. The actual values are
very sensitive to wind direction and wind speed from
just above the surface up to 600mb. This happens to be the layer
that we have the least confidence in. I used the
bunkers method storm motion of 25025kts which was probably a decent
estimation of the storm motion. In the absence of
radar data the Bunker's method will have to suffice.
The surface based CAPE was fairly easy to approximate since this calculation is sensitive to quantities that are known.
The 21 and 22 UTC surface charts show temperatures near 80F and a dewpoint of 66F, along with backed surface
winds. 500-200mb temperatures changed very
little between
12 and 00 UTC. The approximate sounding for Scottsbluff
for 21 and 22 UTC shows 3500 j/kg.
Note that the surface cold front was still behind
the storm at 22 UTC. The 23 UTC surface map shows the cold front
finally through Scottsbluff.