A September Snowstorm
September 20-21, 1995
Brief Overview
September
snowstorms are rare in southwest Kansas. The biggest September
snow
of the 20th century for the Dodge City county warning area
occurred on September 20-21, 1995.
Parts of northwest Kansas and northeast Colorado received 6 to 12
inches of snow. Much of the
northern, central and western part
of the Dodge City warning area received measurable snow. The highest
amounts were in
Ness and Lane counties where some places
reported 6 to 7 inches. Widespread snow amounts of 1 to 3 inches
were reported in other areas.
Only trace amounts fell east and south of Dodge City. Most of the
snow fell between 06 and 14 UTC September 20. In areas north of
Dodge City and Jetmore the heaviest snow fell before 10-11 UTC.
Discussion
It was very warm ahead of the September 20-21 system. On the 18th at 21 UTC
it was warm and humid across the southern and central plains. At Dodge
City it was very muggy with a temperature and dewpoint of 83F/68F.
Dewpoints in the mid 60sF could be found as far north as North Platte,
NE.
On September
20, 1995 at 12 UTC,
a jet streak and associated surface front were located across the southern Plains. The effective boundary
pushed a little to the south because of convection, but essentially
remained almost stationary through September 21st in Texas. Meanwhile,
a very cold upper trough dropped south/southeast out of Canada
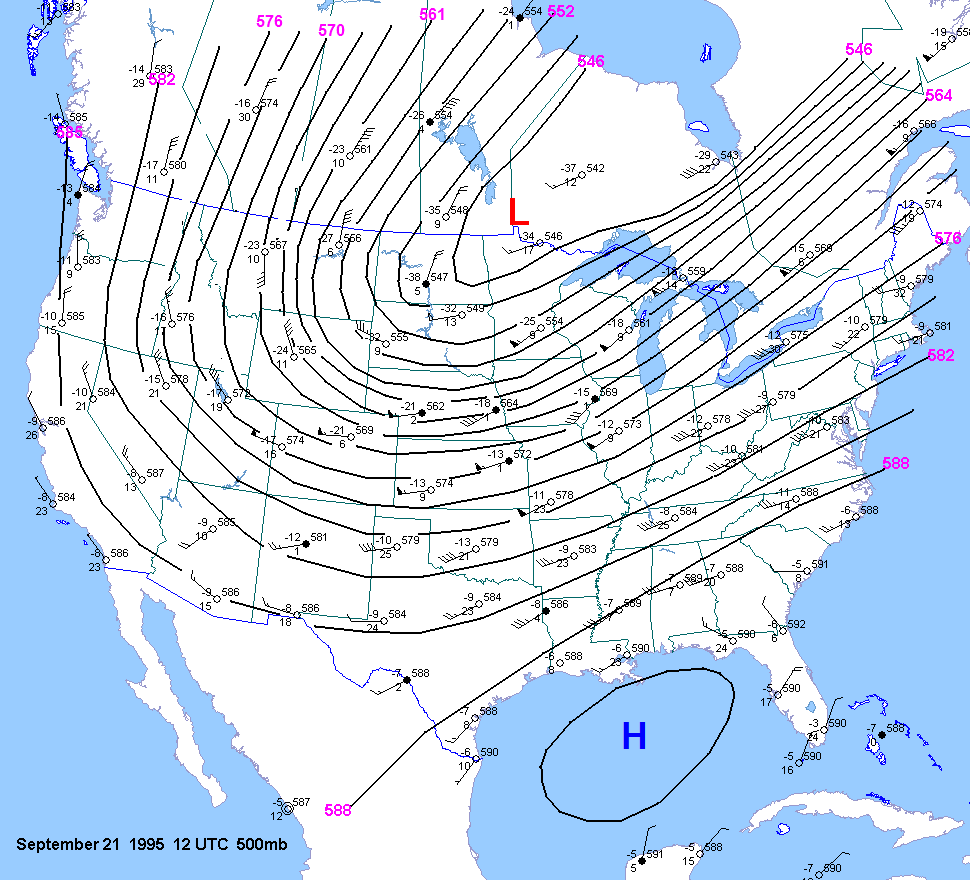
into the central and northern plains. A shortwave trough was
located on the back side of this trough over the northern Rockies as
shown by the
500mb chart. There was a very tight baroclinic
zone associated with the mid level front as shown on the
700mb chart. The 18 UTC
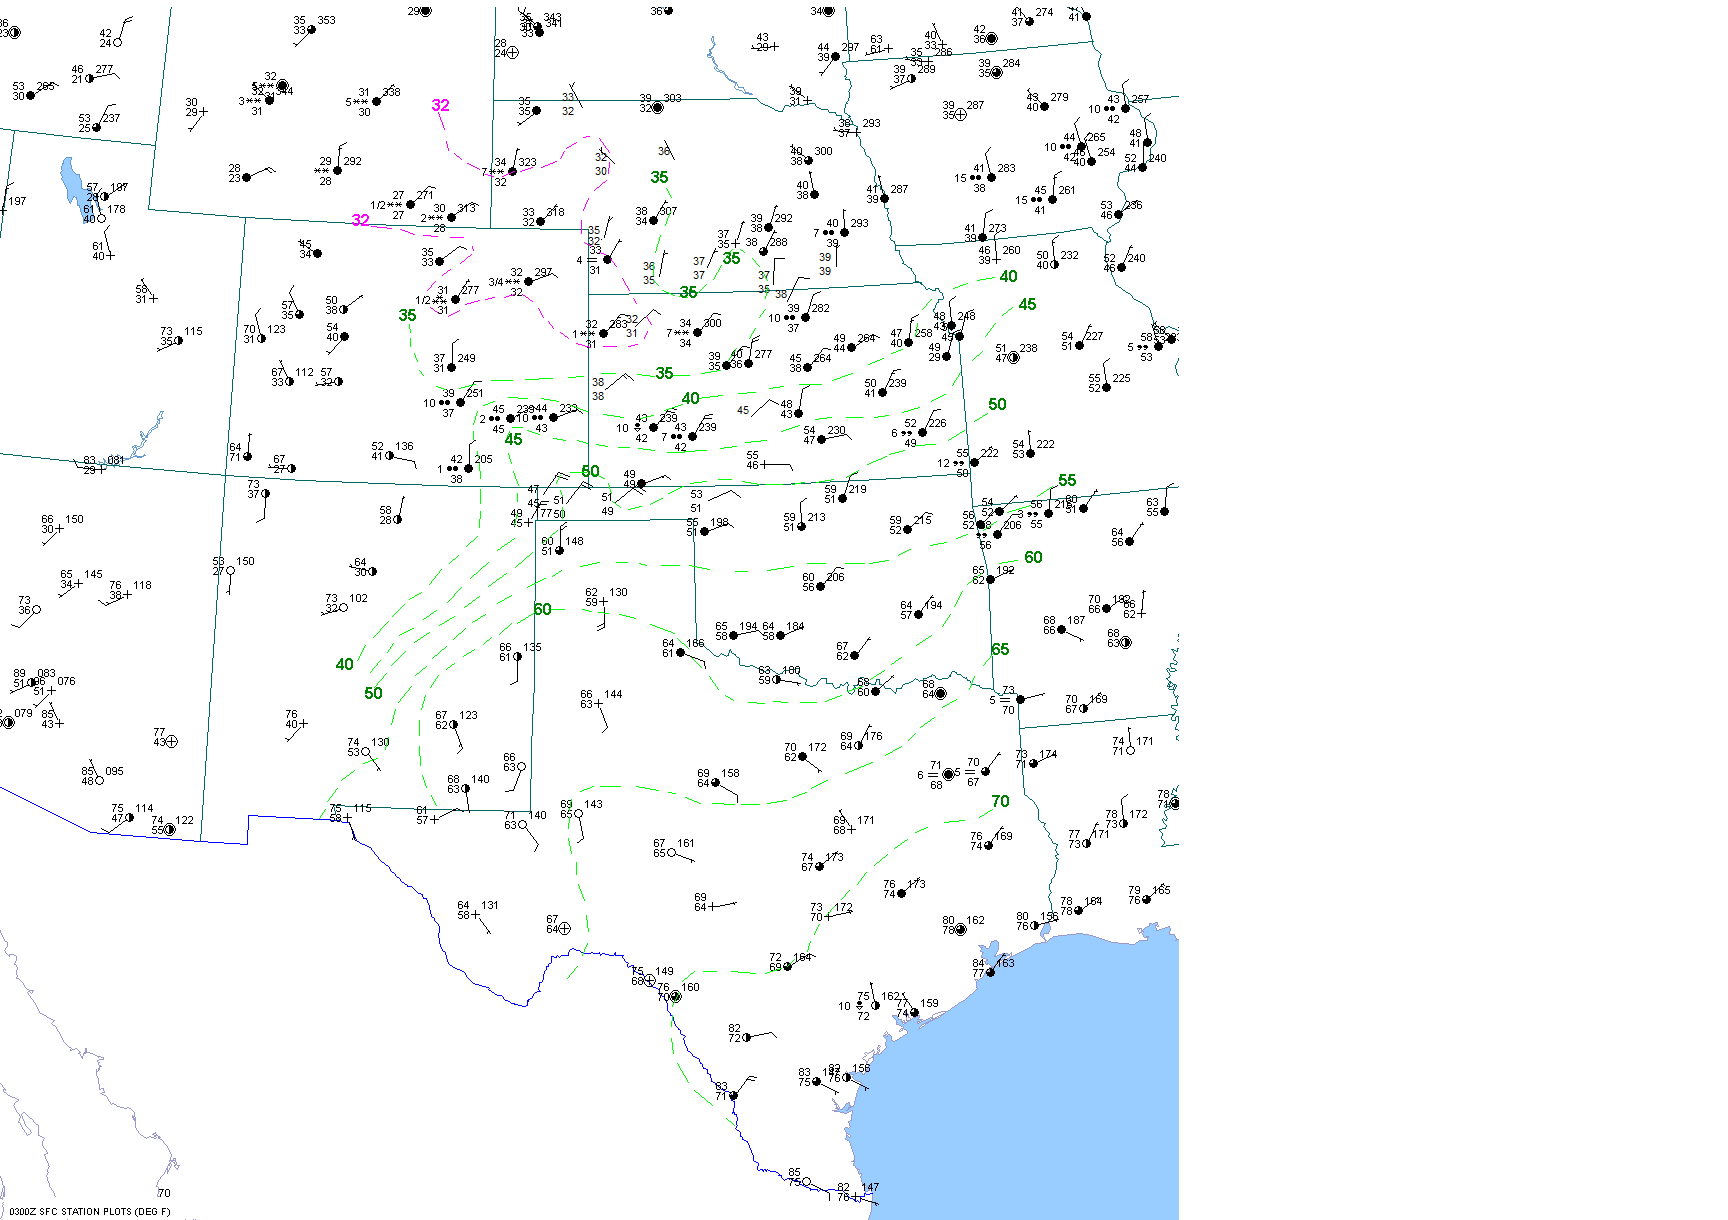
surface chart shows dewpoints along the Texas coast in the upper 70sF. The 21 UTC
surface chart showed a
surface front associated with the northern trough from central Colorado into Kansas and Iowa.
By 00 UTC 21
Sept., the
mid level baroclinic zone had sagged south into Colorado. The northern
jet streak extended from Idaho to Colorado and
Minnesota. The
21 and
00 UTC surface charts showed the rain-snow line moving south into northeast Colorado (Akron). The
500mb chart showed very high heights with very warm 500mb temps from DDC southward.
The
03,
06,
09 and
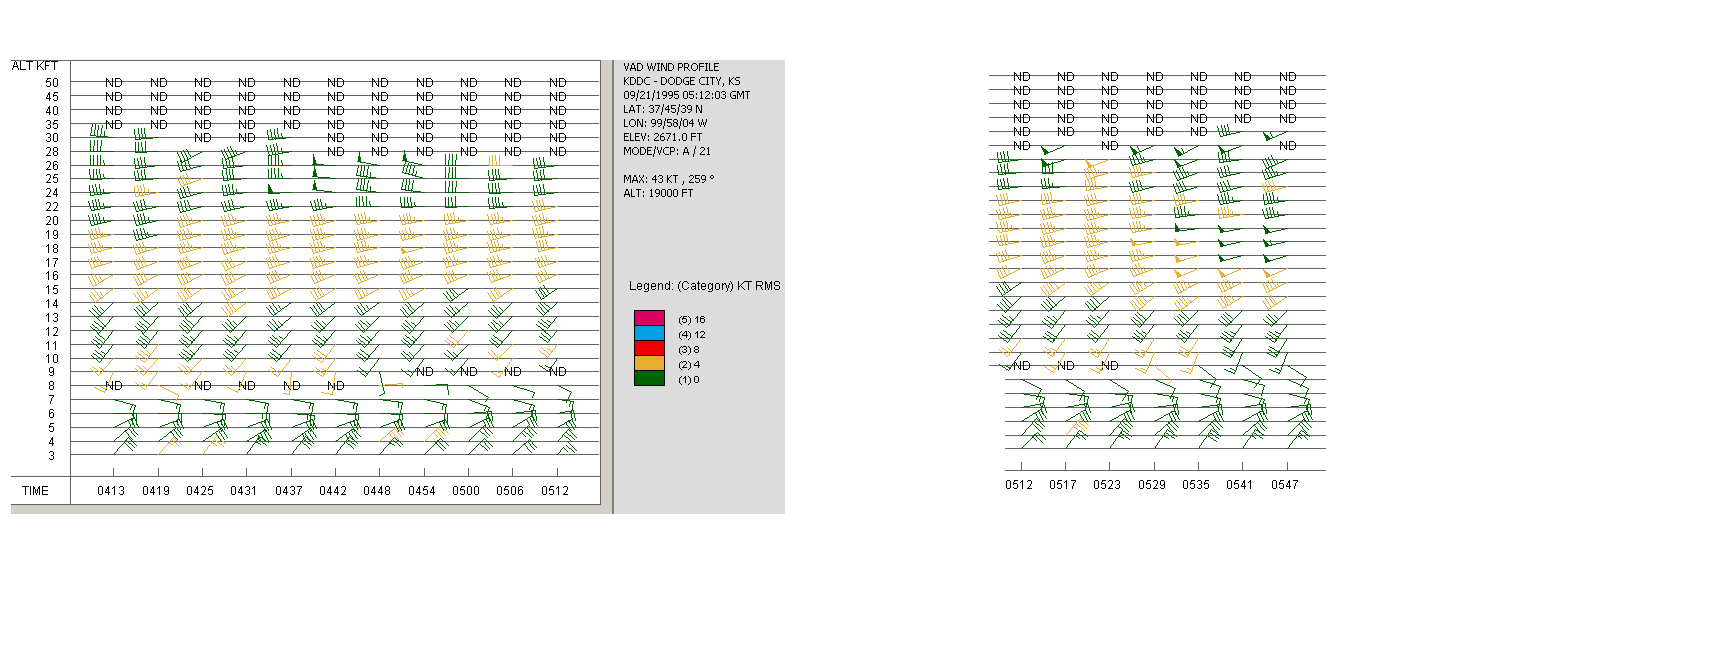
12 UTC surface charts show the rain-snow line moving south through Dodge City. Rain changed
to snow in Garden City around 0730 UTC. Although Garden City missed the heaviest snow,
surface observations from there indicated thunder. The max snow depth was 3". Here is the VAD
wind profile at Dodge City from 4 to 6 UTC. At 03 UTC,
surface dewpoints were still in the 40sF across much of southwest KS. Even Hays, KS had a 39F dewpoint.
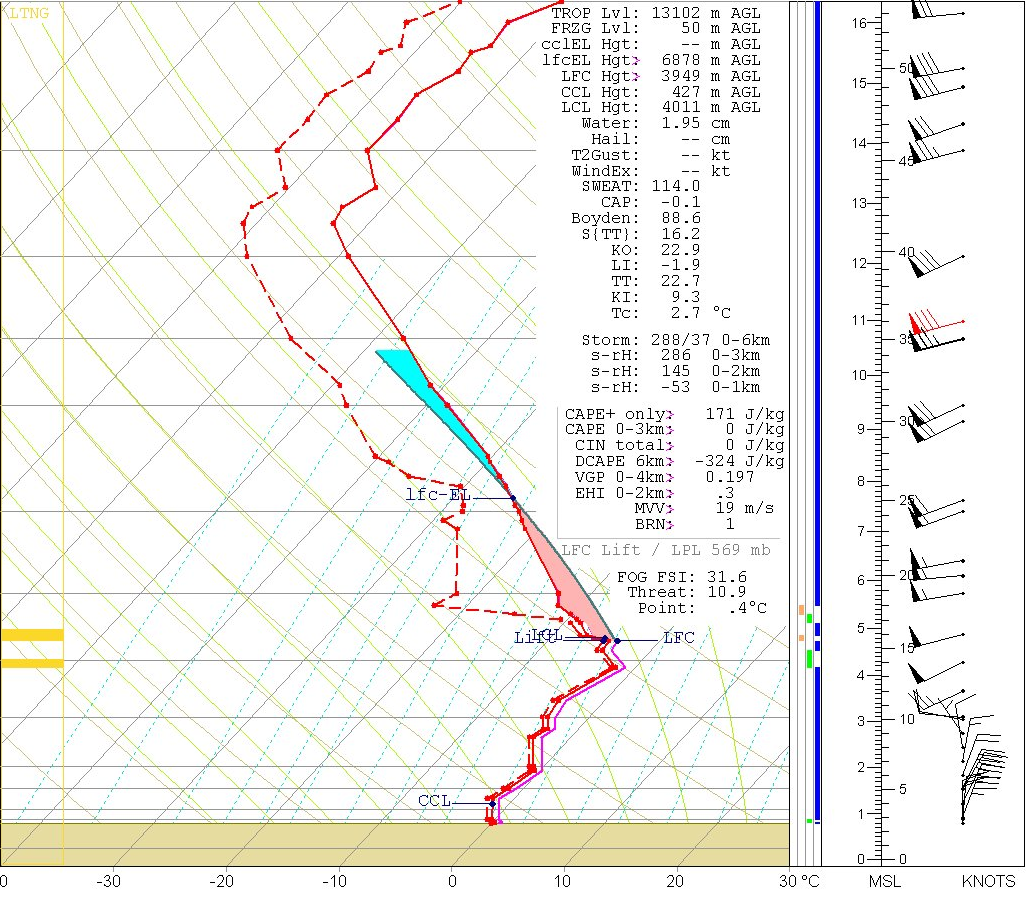
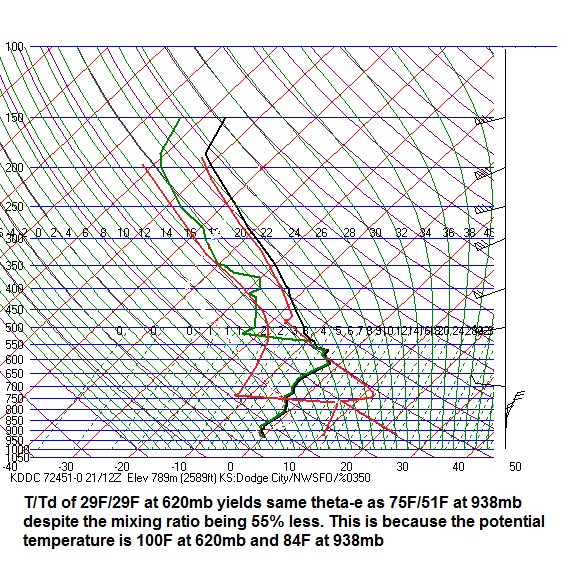
The 12 UTC
sounding
from Dodge City showed a nearly isothermal profile from the surface to
600mb. The elevated CAPE was about 170 j/kg. This yields very high
600mb mixing ratios
from 5 to 6 g/kg with T/TD values around -2 to -3 C !! The
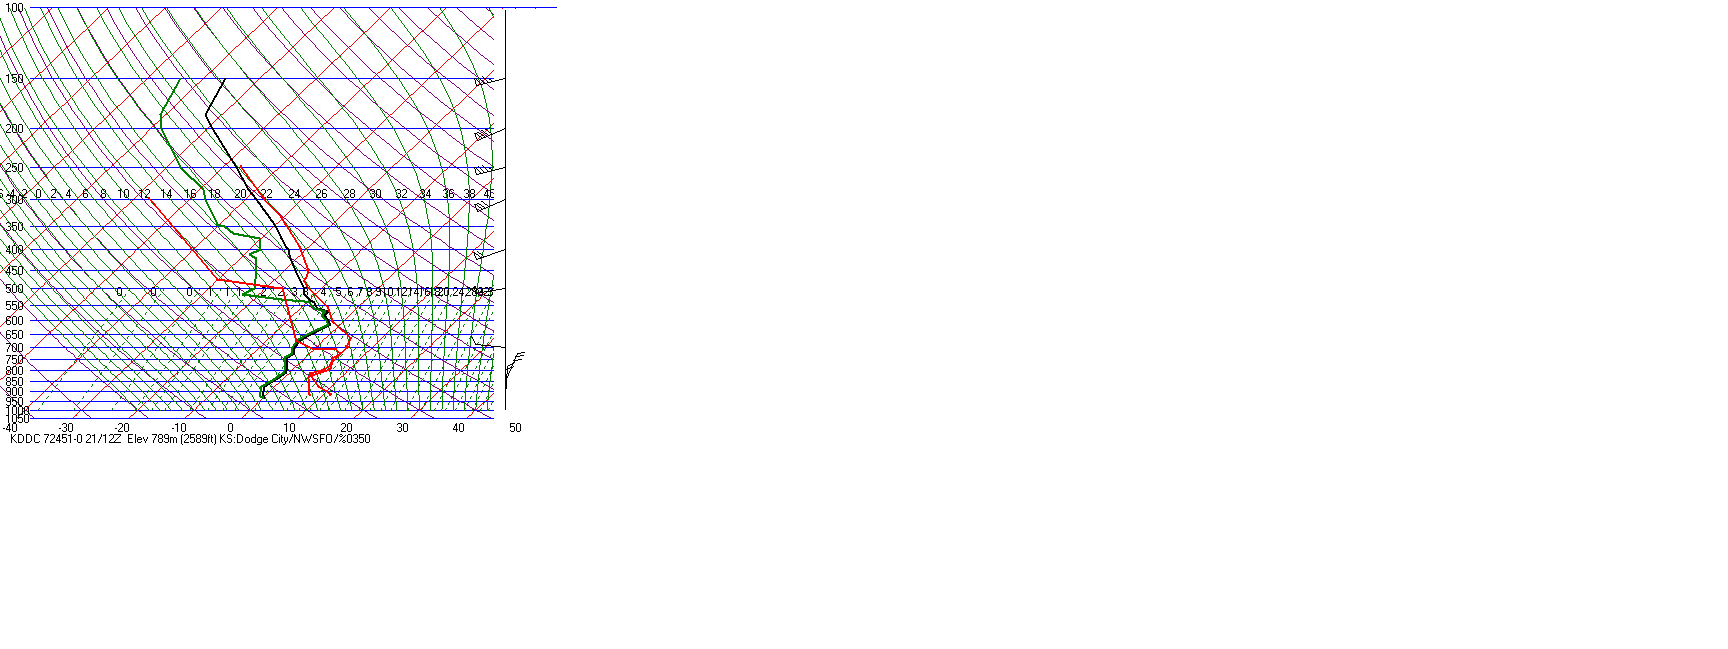
00 sounding can be found here for comparison. Western Kansas
was in the right rear quad of the
upper jet by 12 UTC. The 12 UTC 500mb chart is
here. The 12 UTC sounding was
compared
to a typical sounding in May. Note that 29F/29F at 620mb yields
the same theta-e was 75F/51F at 938 mb despite the mixing ratio
being 55% less. This is because the potential temperature is 100F at
620mb and 84F at 938mb.
A
comparison
of the 00 UTC and 12 UTC soundings at DDC shows dramatic cooling below
650mb while temperatures around 620mb remained unchanged. There
was modest cooling at upper levels but the upper levels remained very
warm. In fact it was -13C at 500mb when the snow was
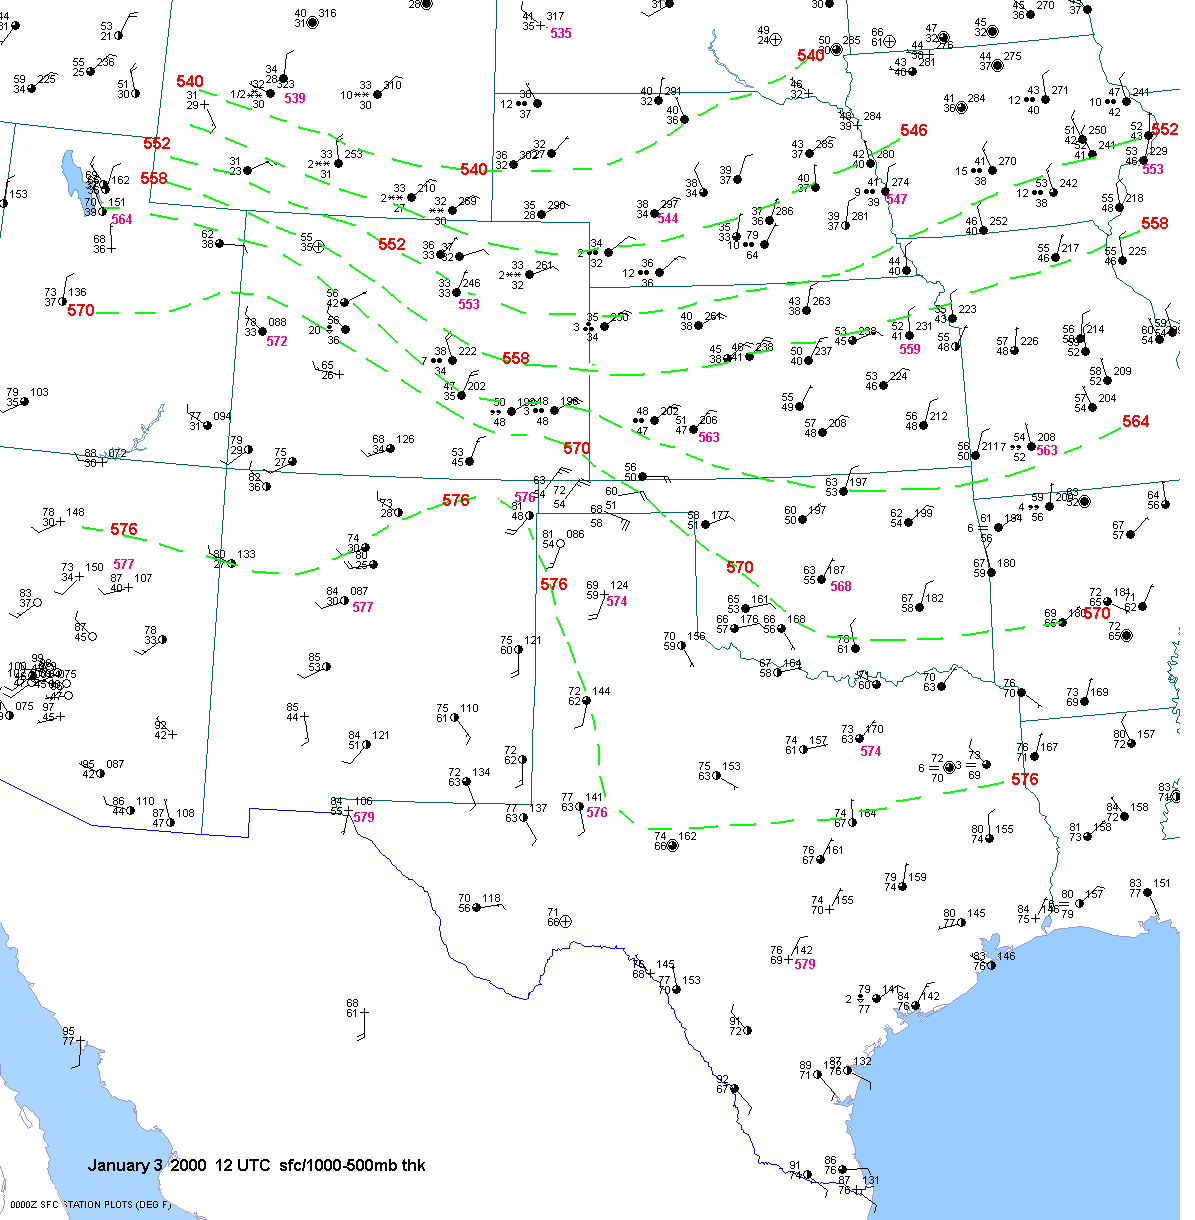
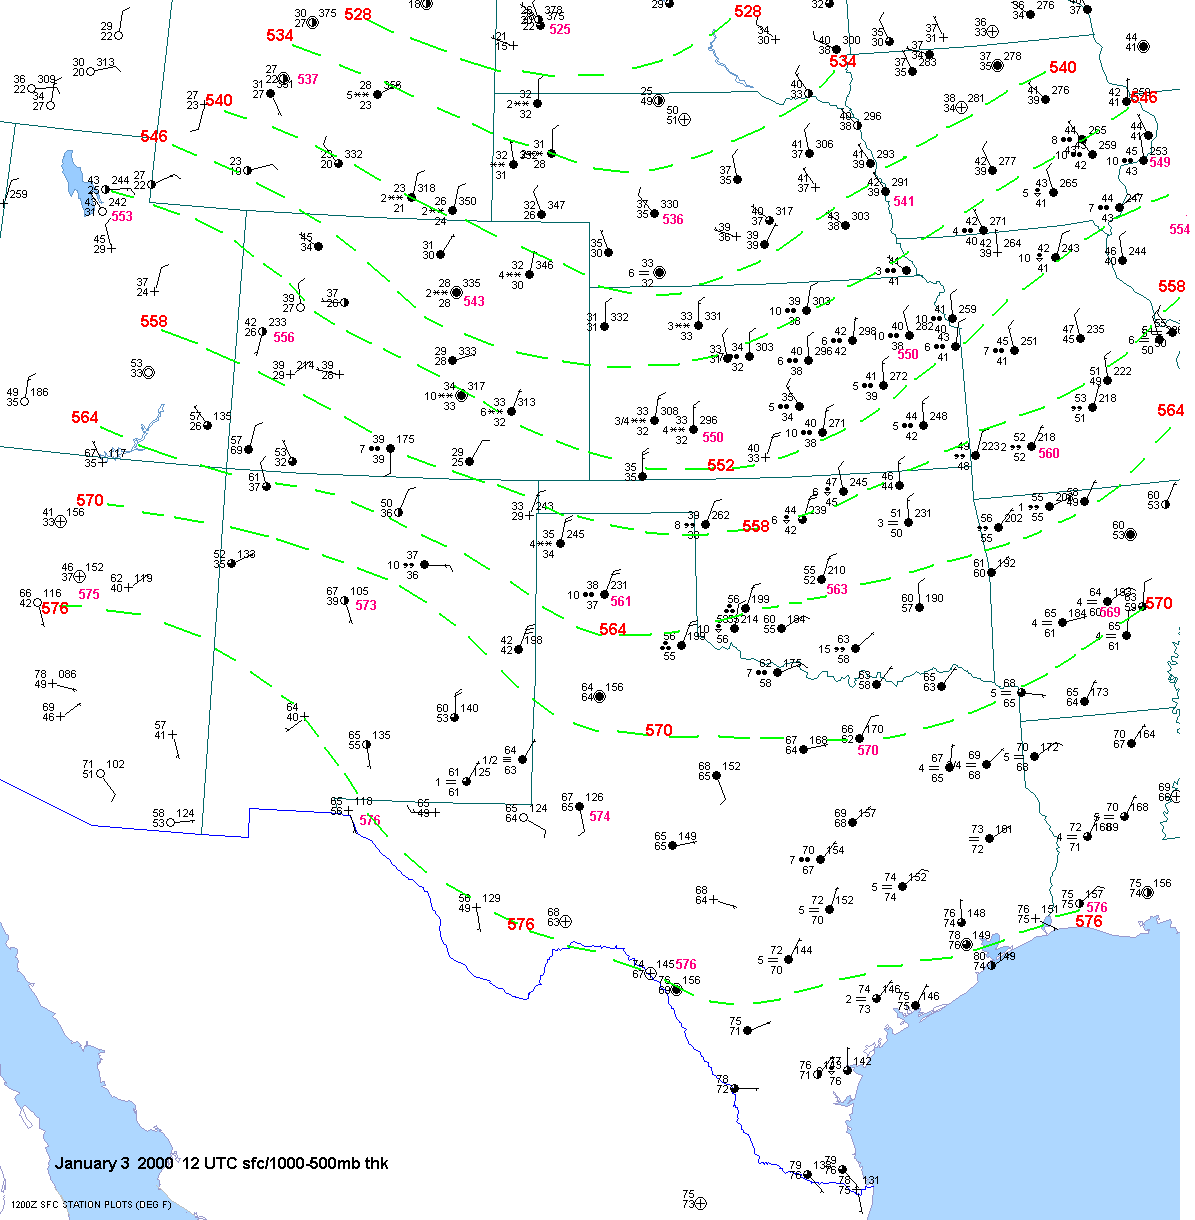
falling. 1000-500mb
thicknesses were very high for this event and varied from 563 dm at
Dodge City at
00 UTC to 550dm at
12 UTC. In our
northern counties the thickness varied from 559dm at 00 UTC to 545dm at
12 UTC. This is because the temperature
profile was nearly
isothermal from the surface to 600mb, with very balmy 600-500mb temps.
Some folks talk about how warm ground
temperatures preclude snow
accumulation. This case serves as an excellent example of
how heavy snow will accumulate even when temperatures have
recently been
warm.
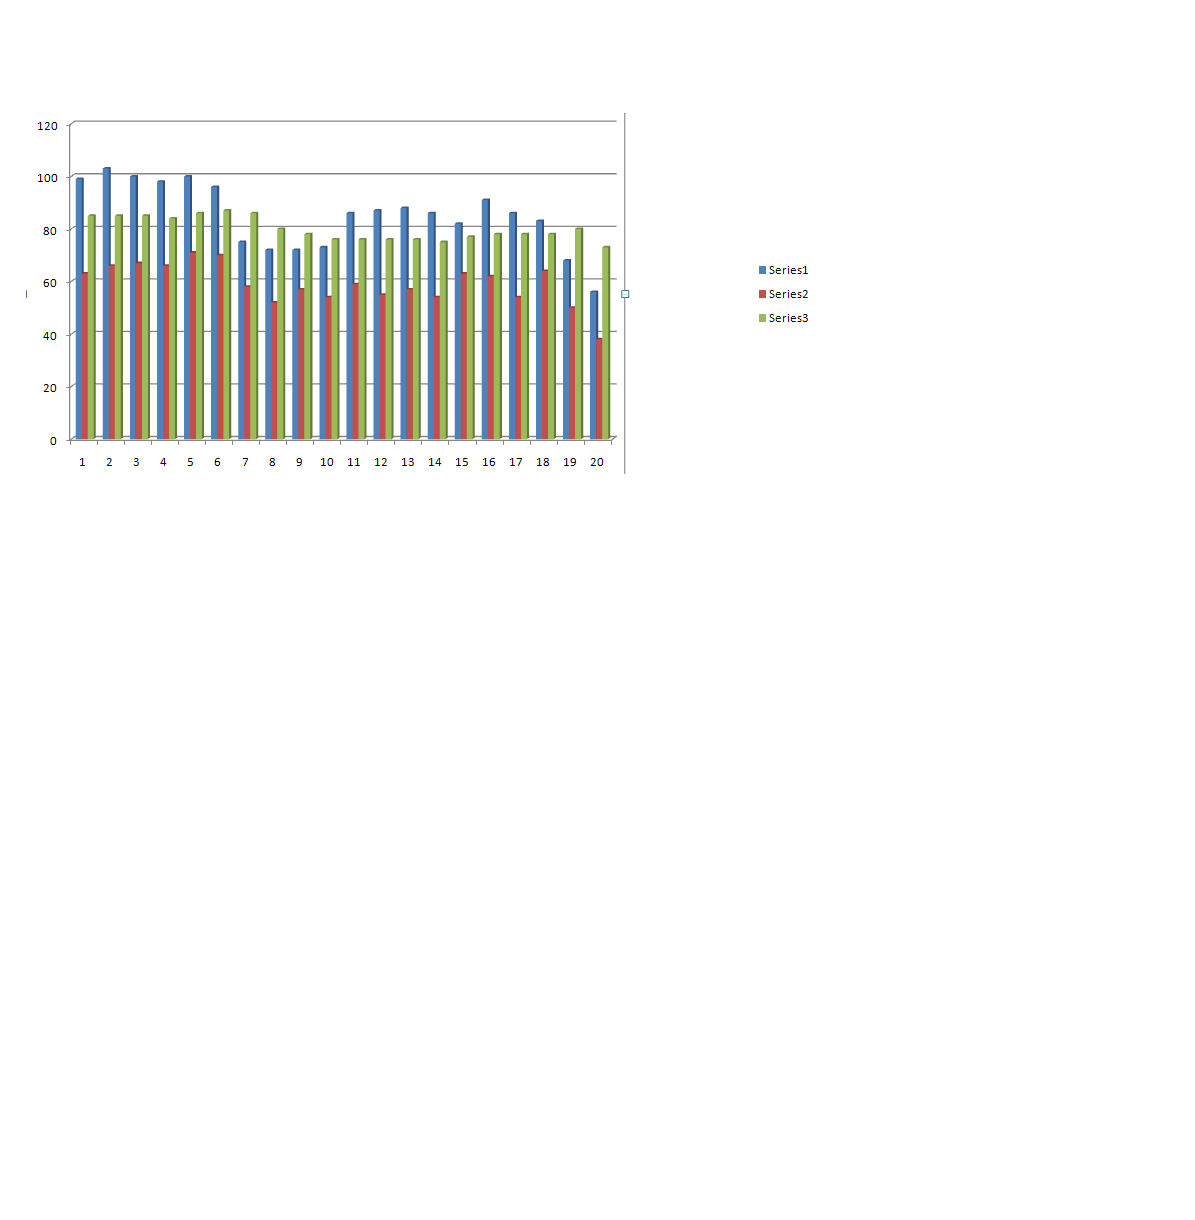
Here
are the highs, lows and average temperatures for Dodge City
for September 1995. The coolest minimum temperature
leading up to the event was
52F on Sept. 8 and 50F on Sept 19. In fact the
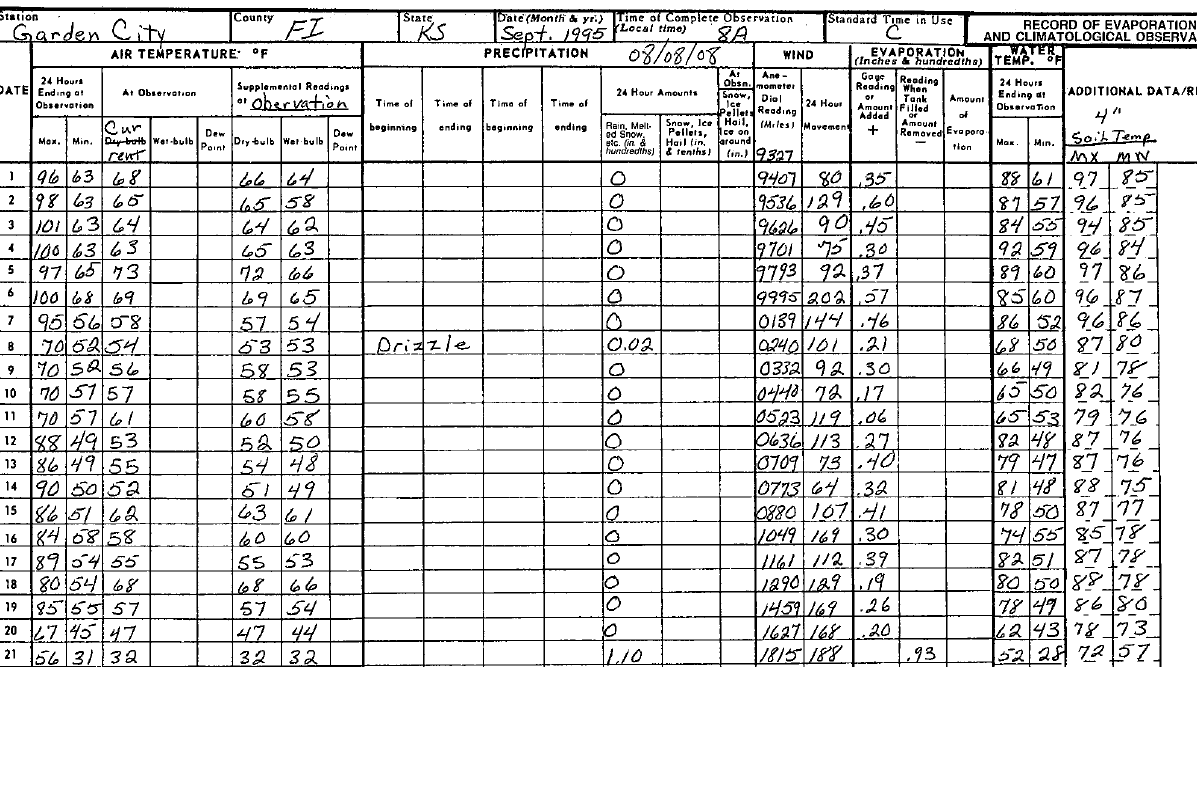
4" soil temperatures at the Garden City Experiment Station were very warm. The minimum soil temperature from Sept 20 at 8 am to
Sept 21 at 8 am was 57F. The maximum was 72F. So 18 hrs before
thundersnow was reported at GCK the soil temperature was around
72F. After the event at Garden City the 4" soil temperature
was down to 57F.
Radar Loops
Here is a composite reflectivity loop for the event. Here is a base reflectivity loop from 00 to 15 UTC.
Synoptic Charts
Surface charts:
21 UTC Sep 20
00 UTC Sep 21
03 UTC Sep 21
06 UTC Sep 21
09 UTC Sep 21
12 UTC Sep 21
500mb charts:
12 UTC Sep 20
00 UTC Sep 21
12 UTC Sep 21
700mb charts:
12 UTC Sep 20
00 UTC Sep 21
12 UTC Sep 21
850mb charts:
00 UTC Sep 21
250mb charts:
12 UTC Sep 20
00 UTC Sep 21
12 UTC Sep 21